
Ravilloles | |
|---|---|
 The town hall in Ravilloles | |
 Coat of arms | |
Location of Ravilloles  | |
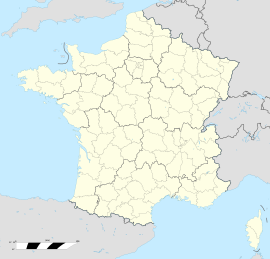 Ravilloles  Ravilloles | |
| Coordinates: 46°25′35″N 5°48′11″E / 46.4264°N 5.8031°E | |
| Country | France |
| Region | Bourgogne-Franche-Comté |
| Department | Jura |
| Arrondissement | Saint-Claude |
| Canton | Saint-Claude |
| Government | |
| • Mayor (2020–2026) | Roger Morel-Fourrier[1] |
| Area 1 | 7.79 km2 (3.01 sq mi) |
| Population (2021)[2] | 450 |
| • Density | 58/km2 (150/sq mi) |
| Time zone | UTC+01:00 (CET) |
| • Summer (DST) | UTC+02:00 (CEST) |
| INSEE/Postal code | 39453 /39170 |
| Elevation | 590–980 m (1,940–3,220 ft) |
| 1 French Land Register data, which excludes lakes, ponds, glaciers > 1 km2 (0.386 sq mi or 247 acres) and river estuaries. | |
Ravilloles (French pronunciation: [ʁavijɔl]) is a commune in the Jura department in the region of Bourgogne-Franche-Comté in eastern France.[3]
YouTube Encyclopedic
-
1/5Views:3 5538 4361 9576512 911
-
Stages créatifs à l'Atelier des savoir-faire - Ravilloles (Jura)
-
Visite de l'Atelier des savoir-faire (Jura)
-
LES ATELIERS CREATIFS ADULTES A FAMPOUX
-
Etre bu ou vieillir en cave... - Episode 2/3
-
Nuances de vert - Montagnes du Jura
Transcription
Population
| Year | Pop. | ±% p.a. |
|---|---|---|
| 1968 | 294 | — |
| 1975 | 330 | +1.66% |
| 1982 | 332 | +0.09% |
| 1990 | 382 | +1.77% |
| 1999 | 404 | +0.62% |
| 2009 | 507 | +2.30% |
| 2014 | 493 | −0.56% |
| 2020 | 448 | −1.58% |
| Source: INSEE[4] | ||
See also
References
- ^ "Répertoire national des élus: les maires" (in French). data.gouv.fr, Plateforme ouverte des données publiques françaises. 13 September 2022.
- ^ "Populations légales 2021". The National Institute of Statistics and Economic Studies. 28 December 2023.
- ^ INSEE commune file
- ^ Population en historique depuis 1968, INSEE
External links
- La Vie á Ravilloles, local Facebook page
Wikimedia Commons has media related to Ravilloles.
This Jura geographical article is a stub. You can help Wikipedia by expanding it. |