Transport connectivity and trends compared across the globe
Download the Statistics Brief as a visual PDF
Leading the charge: Railway electrification data ranked
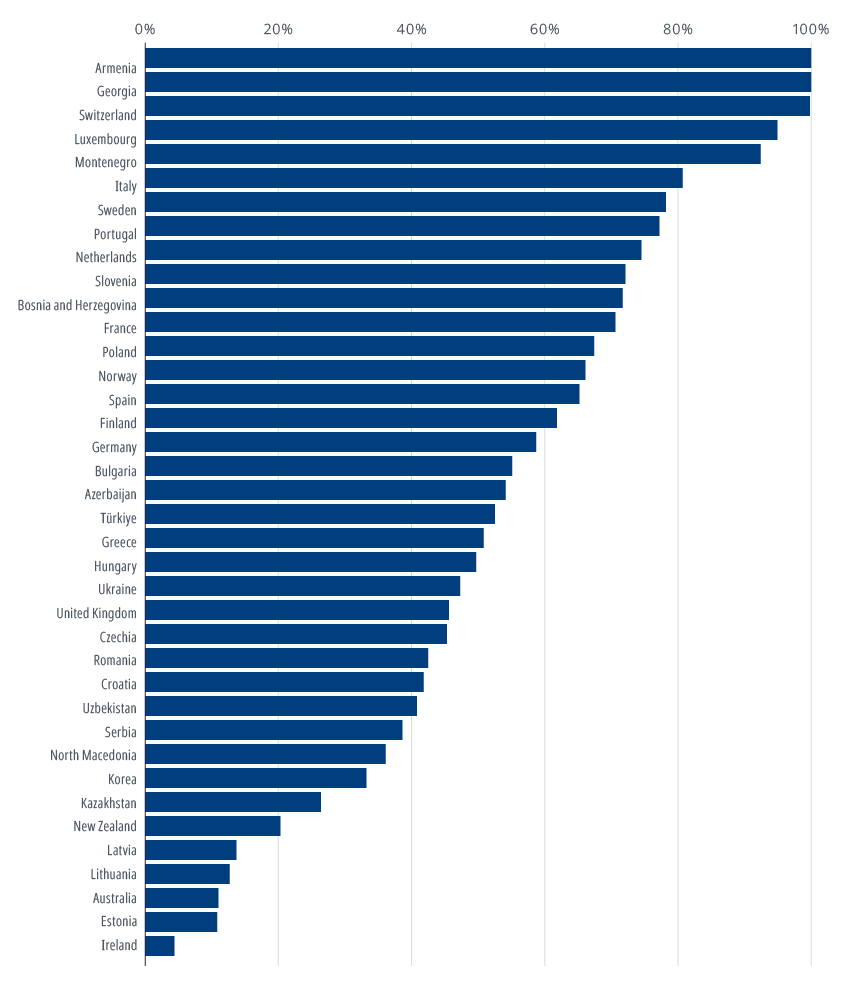
This ITF Statistics Brief offers our first-ever measure of rail electrification across the globe. With transport heavily reliant on fossil fuels – for almost 91% of its final energy needs – data on inter-urban railway electrification offers a snapshot of how future transport emissions can be affected by optimal low-carbon mobility policies.
Best in class: Greece
Greece shows the biggest increase in railway electrification, doubling over the past decade. Since the 2010s, Greece’s rail network has been extensively modernised. Major electrified routes include those between the capital Athens and Thessaloniki, Athens and Kiato, and areas around Athens.
The newly electrified railway line from Athens to the second-largest city, Thessaloniki, is completed and operational. The new main “Piraeus-Athens-Thessaloniki” rail axis provides a modern and fully inter-operable, double-electrified railway line.
Türkiye 100% electric in 2023
Türkiye’s share grew by a significant 23 percentage points, with aims to electrify the entire conventional rail network by the end of 2023, according to Turkish Railways (TCDD). Between 2012 and 2016, TCDD’s costs for electric energy dropped by 17%, while fossil fuel consumption for the same period dropped from 130 million litres to 95 million litres.
Armenia and Georgia already have 100% electrification due primarily to the small size of both nations and a relatively simple railway network. Armenia’s rail network was significantly expanded and electrified during the Soviet period, especially in the post-war years.
Who’s leading the world’s rail electrification?
Share of electrified rail infrastructure, 2022 or most recent data year
How well do road and rail connect people and goods?
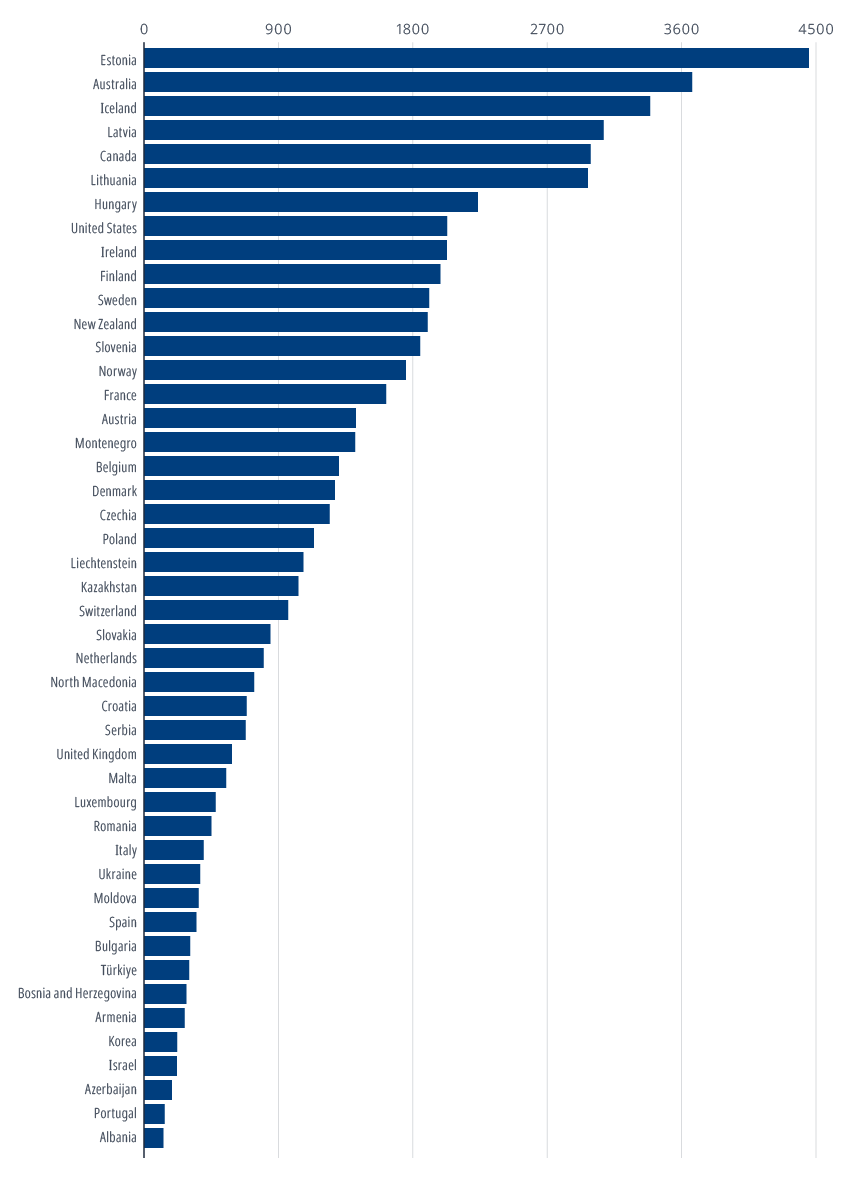
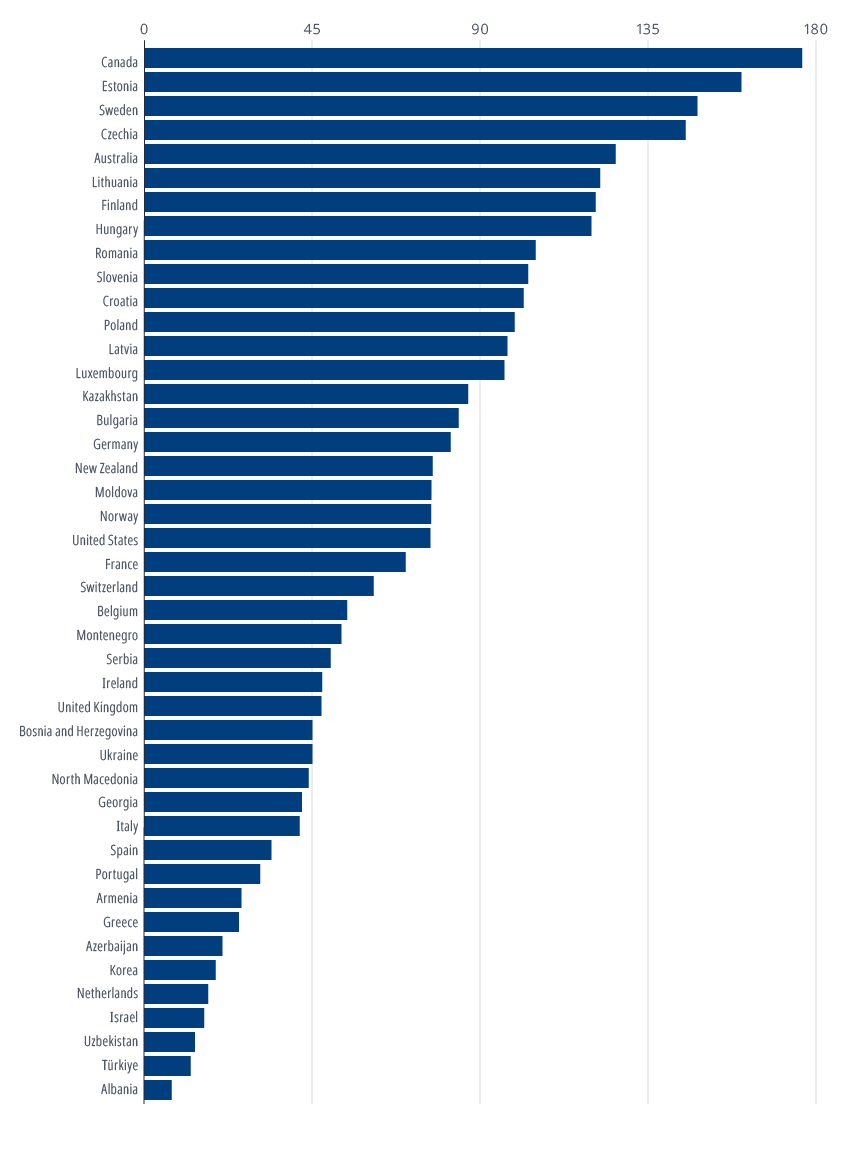
This brief includes a proxy measure of connectivity, the road and rail network length per population. This indicates the extent of transport infrastructure available to serve the population in each country.
Estonia leads for greatest road length per capita and is second for railway length. Canada’s leading rail track length per population is used primarily for freight, 62% of which is moved by rail mainly servicing the US and international markets via coastal ports. Albania’s challenging mountainous terrain and past political isolation have impeded road development, as shown in the data. The central European country is now undergoing significant investment in the road network.
How connected is your country by road?
Road network length per 100 000 inhabitants, 2022 or most recent data year
How connected is your country by rail?
Railway track length per 100 000 inhabitants, 2022 or most recent data year
War in Ukraine redraws Europe’s goods transport
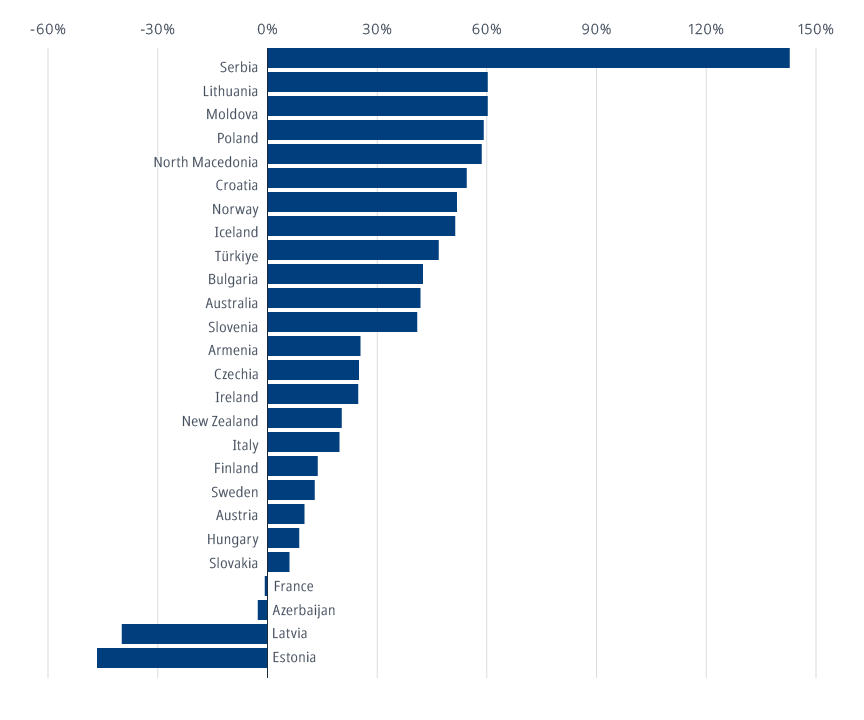
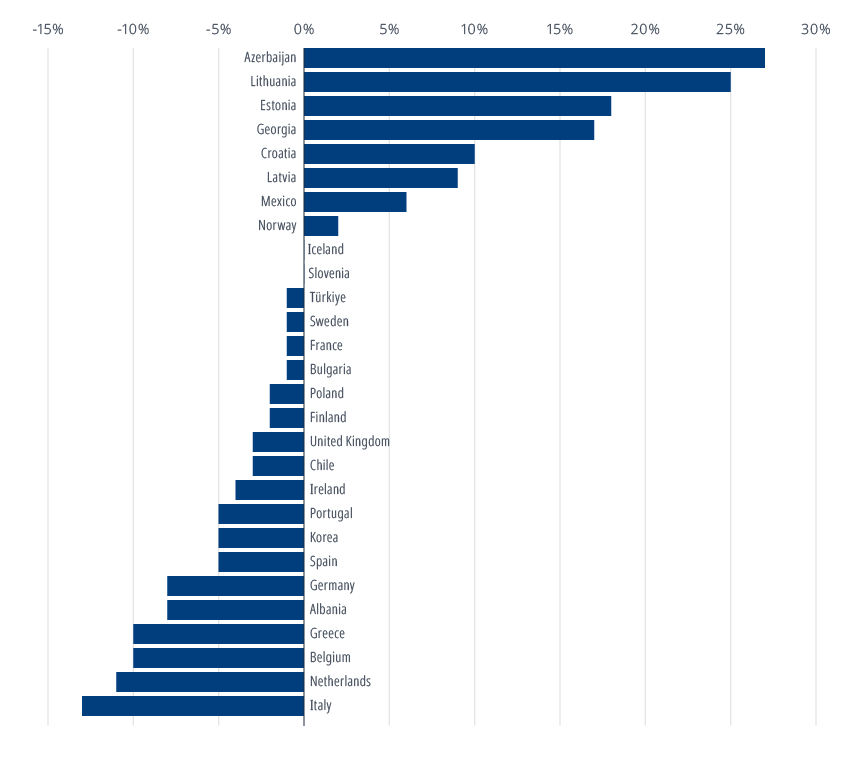
The plummeting demand for freight transport in Estonia and Latvia highlights the radical changes in European transport since the beginning of the war in Ukraine in 2022. A drop in demand for rail freight traffic through the Baltic states is directly linked to economic sanctions introduced by the European Union against Russia, and subsequent countersanctions.
Serbia’s leading performance for road freight transport is supported by improved customs efficiency and border management. Road has replaced rail as the leading freight mode in the strategically located Balkan nation which provides essential connectivity to its neighbours via the Pan-European Corridor X.
Inland freight transport growth stalls in Estonia and Latvia
Total inland freight transport growth rate, 2012–22 (tonne-kilometre)
Azerbaijan’s Middle Corridor link creates supply chain flexibility
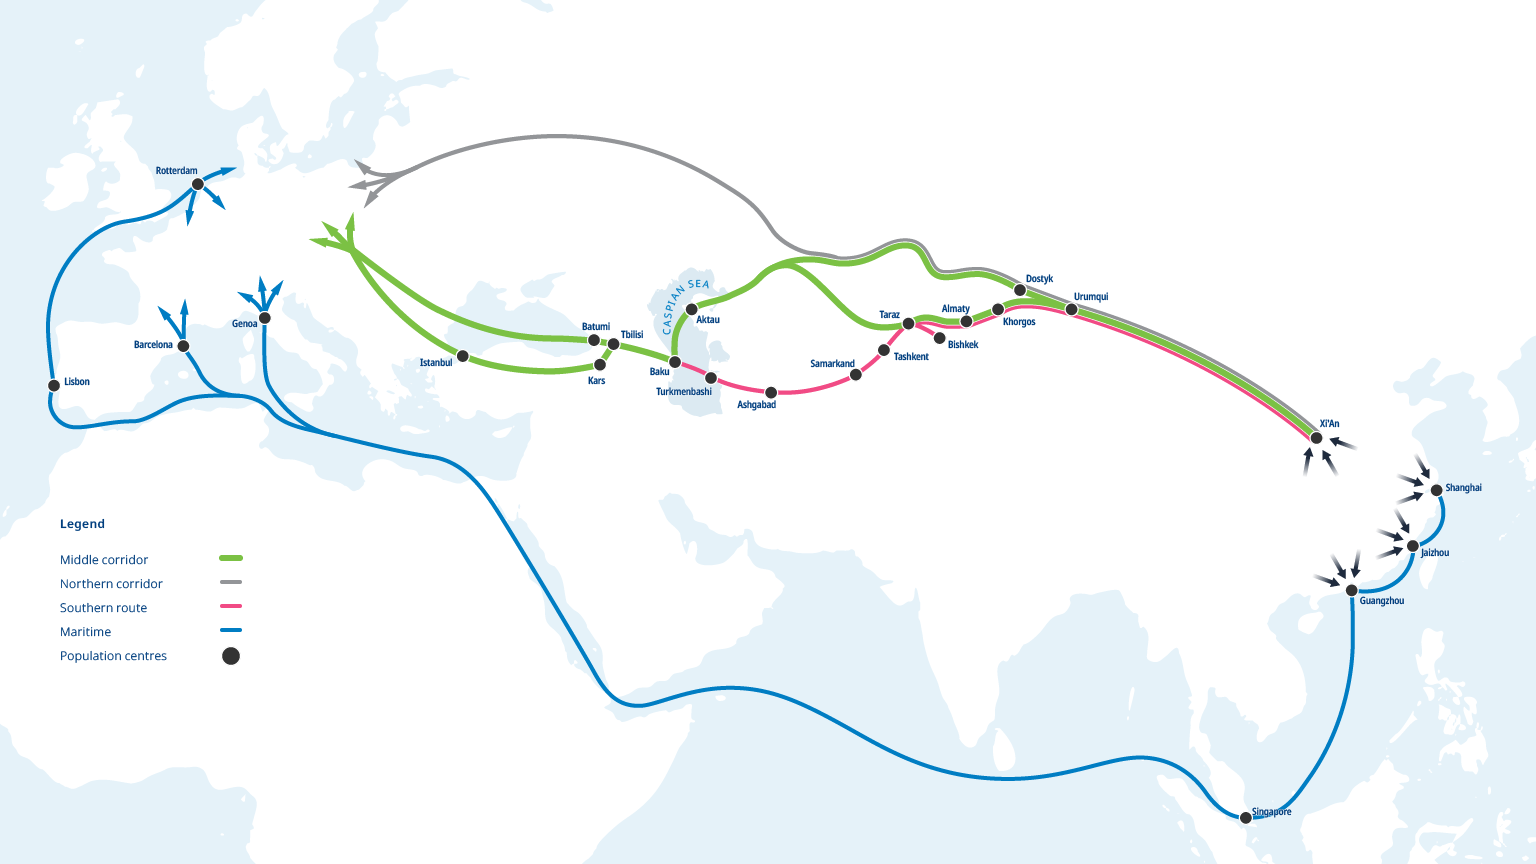
The war in Ukraine has led European transporters to seek alternative East-West trade routes that avoid crossing Russian territory. The so-called Middle Corridor, based on ancient trade routes and crossing the Caspian Sea, has seen a dramatic jump in demand.
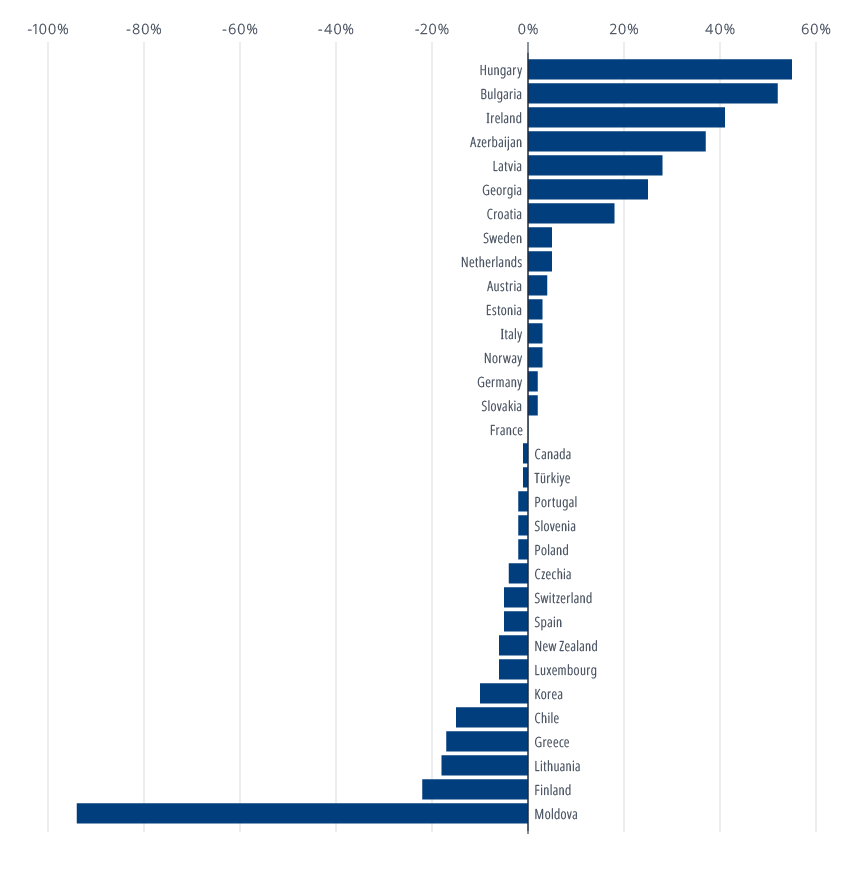
The renewed importance of Azerbaijan’s strategic location on the western aspect of the Caspian Sea is highlighted by the latest transport data as the port of Baku capitalises on new Eurasian traffic seeking to avoid Russia. Between 2021 and 2022, when the war in Ukraine began, data for Azerbaijani transport shows demand for both container seaport and rail transport increased greatly.
Estonia witnessed a transfer from rail transport to seaport traffic, while Georgia’s Middle Corridor position increased seaport demand.
The data confirm a contrary scenario for Moldovan rail transport, which plummets following the outbreak of war.
Transport flexibility following shock of war shows Middle Corridor demand jumping
Container seaport growth rate, 2021–22 (gross tonnage)
Baku’s strategic position
Baku’s position is now at a critical point in the EU’s eastern supply. Goods are shipped by sea from Bulgaria and Romania to ports in Georgia and Türkiye, then loaded onto rail and directed to Baku. From there, they are distributed further to Central Asia, China, India, the Middle East and South Asia through various routes, offering a faster and less expensive alternative to the Suez Canal route.
Efforts are underway to enhance the infrastructure at the Baku International Sea Trade Port, Azerbaijan Railways, and Azerbaijan Caspian Shipping Company (ASCO). These include the development of a more sustainable and efficient freight transport route.
Linking Türkiye and Central Asia
Azerbaijan handles around 20% of road transport between Türkiye and Central Asian countries. This is set to increase with plans to establish a TIR park at Baku Port, along with container facilities and terminals for bulk cargo and mineral fertilizer handling.
Rail freight demand in Moldova plummets following outbreak of war
Container rail growth rate, 2021–22 (gross tonnage)
Switching East-West transport routes follow Caspian Sea Middle Corridor to avoid Russian territory
The Middle Corridor among trade corridors connecting Asia with Europe
The large share of road freight jeopardises climate goals
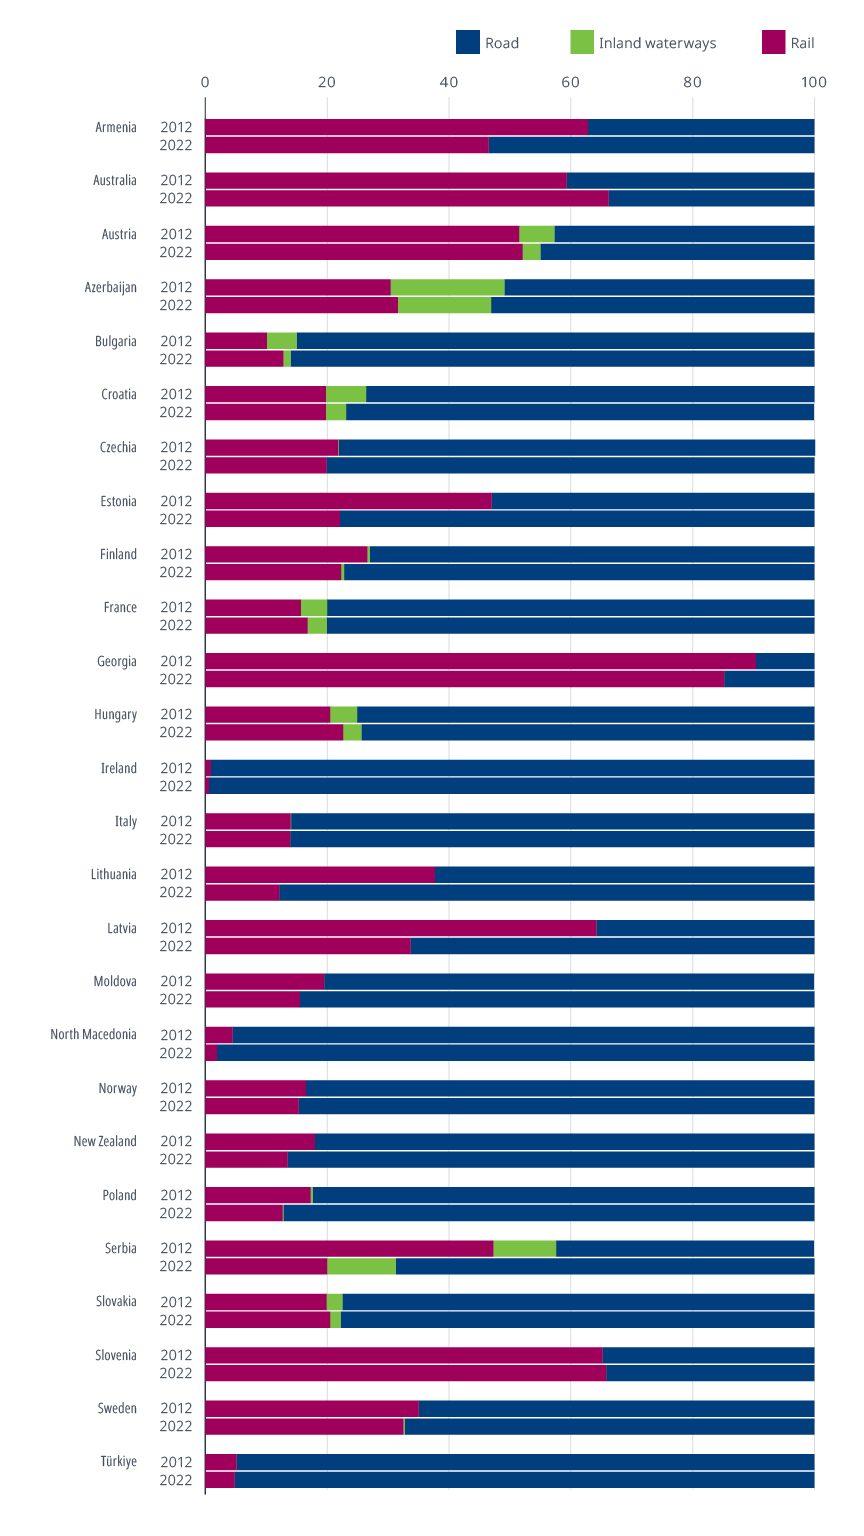
A ten-year view by mode for goods transport reveals that the share of road freight is increasing for most countries.
Only Australia, Azerbaijan and Hungary have seen their share of rail freight increase over the period. Road transport remains highly reliant on fossil fuels when compared to rail and is responsible for over half of all transport-related carbon emissions. These latest data confirm that without a significant modal shift to cleaner goods transport or decarbonising of the road freight sector, the goals of the Paris climate agreement will not be met.
Has your country moved to more sustainable goods transport?
Freight share by mode, 2012 and 2022
Many countries still struggle to return to pre-Covid passenger levels
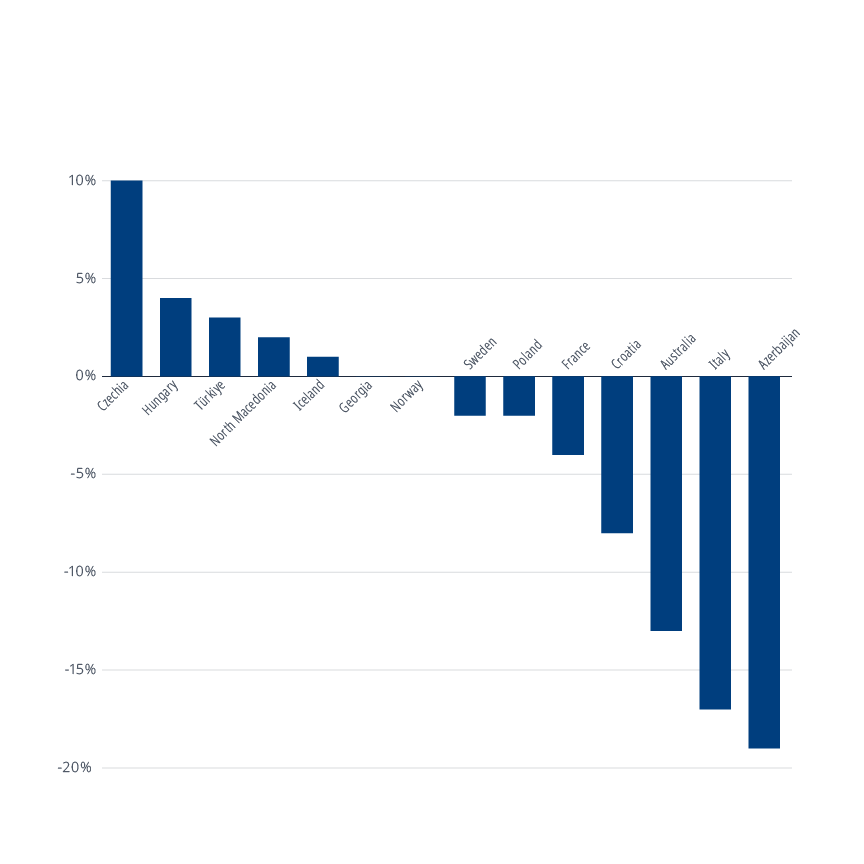
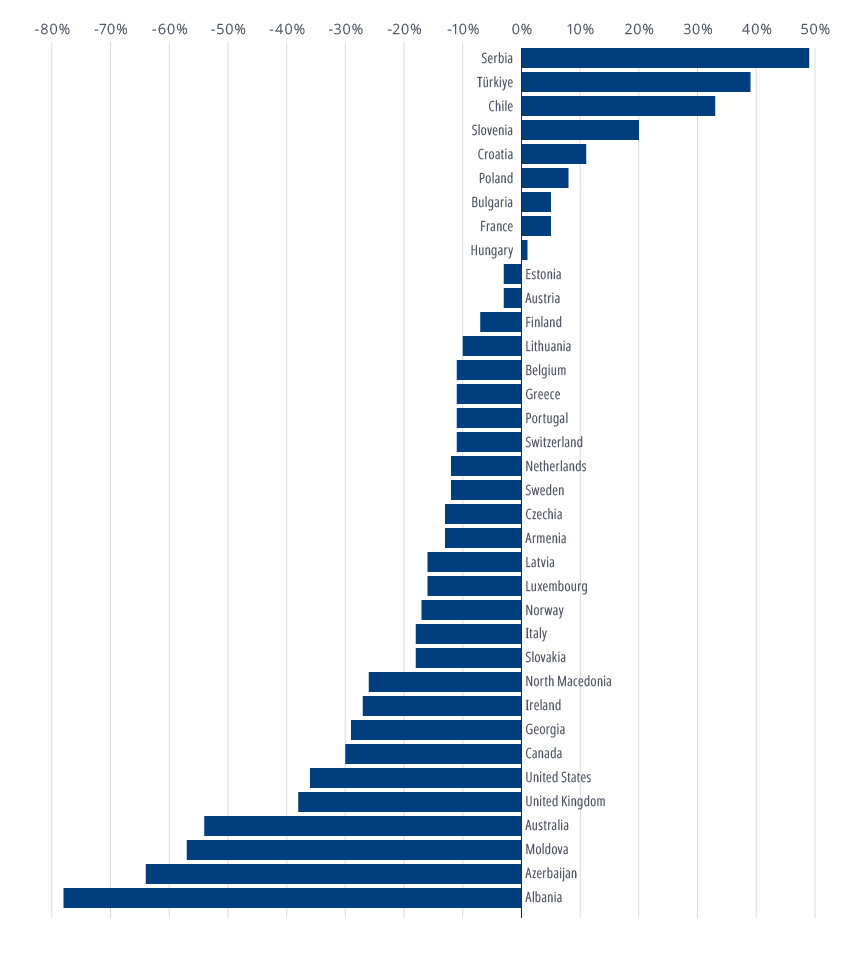
The full data picture for 2022 reveals the movement of people in many countries is still far behind pre-pandemic levels, even a full year after the relaxing of travel restrictions. Our data show that passenger transport by road and rail in Azerbaijan, Italy and Australia - in order of magnitude - is still far below 2019 levels.
Car beats shared modes
Data for countries like Czechia, Hungary and North Macedonia indicate that shared modes (rail, buses and coaches) passenger numbers dropped but car passenger transport saw a notable bounce back, even exceeding the pre-Covid year level, indicating more reliance on personal vehicles. This move towards greater car usage may reflect altered commuting habits and ongoing wariness of using public transport.
Not on the move: Some countries are far behind pre-Covid passenger transport levels
Percentage change in total road passenger transport (2019–22)
Rail passenger numbers lag behind pre-Covid activity in many countries
Total rail passenger transport growth rate, 2019–22 (passenger-kilometre)
All countries miss the UN’s target for reducing road deaths
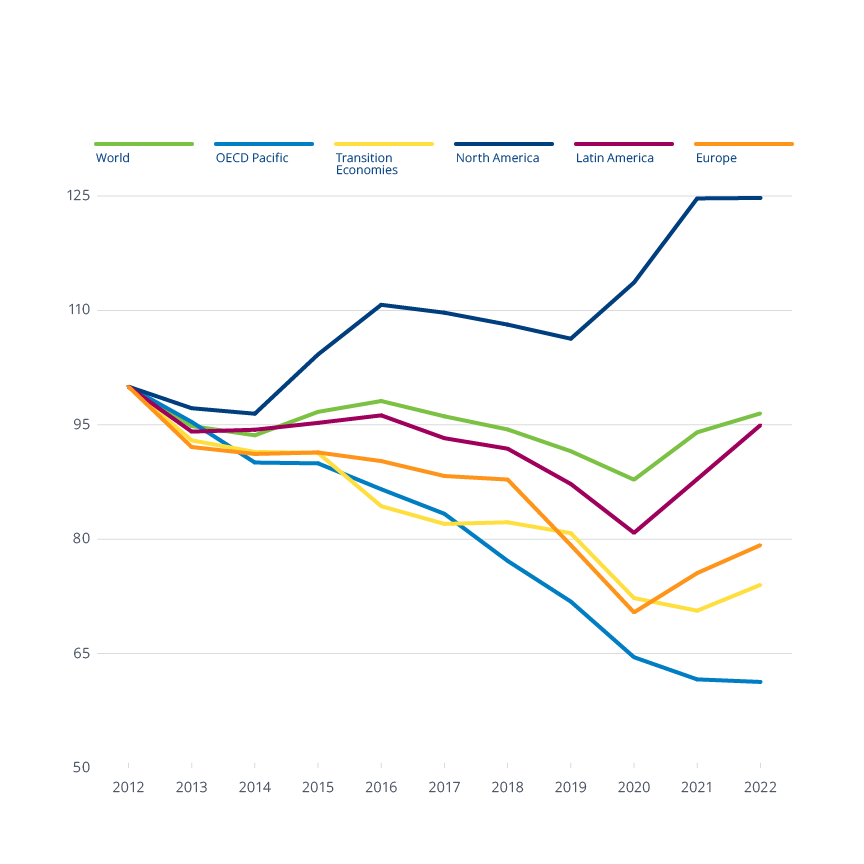
Measures to reduce the number of road crash fatalities on the world’s roads have not achieved their targets during the first UN Decade of Action on Road Safety (2011–20). The latest global data for 2022 show that Norway (48% reduction, relative to the 2012 baseline), Greece (45%) and Switzerland (43%) came close to halving the number of road deaths.
These earliest data for the Second UN Decade of Action for Road Safety (2021–2030) confirm the downward trend in global road fatalities. The data highlight the need for countries to bolster road safety actions to achieve the target of reducing road deaths and serious injuries by 50 per cent by 2030.
Find out more in ITF’s Road Safety Annual Report 2023 with a review of road safety performance for 43 countries, recent road safety developments and a comparison of performance against the main road safety indicators.
How do world regions compare on road safety?
Road crash fatalities, trends by region (2012=100)
About the statistics
The data presented in this Statistics Brief are from the ITF survey “Trends in the Transport Sector”, which includes freight transport, passenger transport and road safety variables. Road safety data include the number of road crashes, injured persons and fatalities (30 days).
The data series starts in 1970 and continues until the current year-1, or the most recent year for which data is available. The survey is completed by ITF member countries, processed by ITF statisticians and published each year on 31 October.
Although there are clear definitions for all the terms used in this survey, individual countries may have different methodologies for calculating tonne-kilometres and passenger-kilometres. These methods could be based on transport or mobility surveys and may use very different sampling methods and estimating techniques, which can affect the comparability of the statistics. ITF recommends reading the metadata to check the data coverage for each country.
Detailed data descriptions and notes on the methodologies are available at the following links:
Freight Transport
Passenger Transport
Road Safety
The data in this Statistics Brief are as of 31 October 2023. Online datasets can be updated following countries’ revisions.
Disclaimer
The opinions expressed and arguments employed herein do not necessarily reflect the official views of the member countries of the ITF. This document, as well as any data and map included herein, are without prejudice to the status of or sovereignty over any territory, to the delimitation of international frontiers and boundaries, and to the name of any territory, city or area.
Date of Publication: 26 January 2024
Further information: Rachele Poggi and Xiaotong Zhang
Download the Statistics Brief as a visual PDF