House Prices in Australia Over the Last 10 Years
Updated: 29th of June, 2022
As we are now halfway through 2022, let’s explore if house prices have changed in Australia over the last 10 years. Have house prices really increased?
Way back in 2011, when the first episode of Game of Thrones was bestowed upon us, and Google+ was launched (that didn’t last long), the average house price in New South Wales was $540,800.
By 2016, it was more than $823,700, and today, the average NSW house price is sitting just above $1.2 million. If you don’t believe us, just take a look at the historical graph we created below, outlining the average dwelling price across all states of Australia.
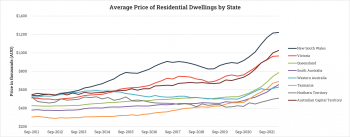
Source: Australian Bureau of Statistics
As of March 2022, the average house price in New South Wales has risen by $675,200 since March 2012, with Victoria’s figures not far behind. That’s a capital gains increase of 123%, which in our books is one solid investment.
Surprisingly, the second top performing state is Tasmania. This state has seen house prices steadily rising over the last decade, with a total increase of 126%.
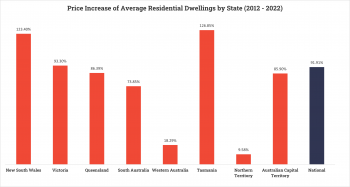
The state to see the lowest return is Northern Territory. The decrease in the region’s housing prices has mostly been due to the multibillion-dollar INPEX gas project, with the construction phase of the project coming to a close back in 2014 causing a temporary boost to their economy due to the influx of new jobs.
Have house prices in Australia doubled over the last 10 years?
In order to clearly understand if this is true, we need to dive deeper into the data and look at the annual percentage change over this period.
According to data provided by the Australian Bureau of Statistics, the national capital gain over the past 10 years comes to 70%, with an annual growth of 5.61%, which is just shy of the 7% needed in order for a property value to double in a 10-year period.
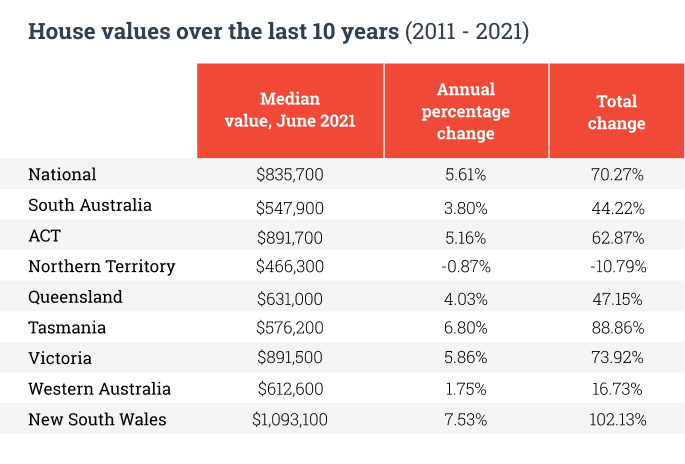
New South Wales has seen an annual percentage change of 7.53% over 10 years, which definitely hits the necessary growth rate amount to double a property’s value in a 10-year period.
Quick Tip: Want to find out how many years it could potentially take for a property in your state to double in value? Simply, divide 72 by the annual growth rate and voila! For example, if we do the math for Victoria, it is likely to take 12.2 years, although this cannot be guaranteed.
Keep in mind, it’s important to consider the annual percentage change in your city or suburb for a more accurate result. To find out what the percentage change in your city is, the Australian Bureau of Statistics have some great resources which you can find here.
How does this affect first home buyers?
As housing prices continue to rise, the average mortgage loan size has also been rising.
Currently, the national mortgage size is increasing at 6.4% per year, whereas the average fixed salary increase recorded for the second quarter of 2021 was 1.5%.
Wage growth hasn’t been able to keep up with the rate of mortgage sizes. This makes housing affordability a big issue for many Australians, particularly first home buyers. To make the matter even worse, according to CoreLogic’s research director, Tim Lawless, “Housing prices have risen almost 11 times faster than wages growth over the past year, creating a more significant barrier to entry for those who don’t yet own a home.”
Are you a first home buyer? Or perhaps you are looking to refinance your home loan? Speak to your local MoneyQuest finance specialist today for assistance.
Disclaimer:
This article is written to provide a summary and general overview of the subject matter covered for your information only. Every effort has been made to ensure the information in the article is current, accurate and reliable. This article has been prepared without taking into account your objectives, personal circumstances, financial situation or needs. You should consider whether it is appropriate for your circumstances. You should seek your own independent legal, financial and taxation advice before acting or relying on any of the content contained in the articles and review any relevant Product Disclosure Statement (PDS), Terms and Conditions (T&C) or Financial Services Guide (FSG).
Please consult your financial advisor, solicitor or accountant before acting on information contained in this publication.


Great post. Thanks a lot.
My name is Lachlan and I’m doing an assignment for year 12 and for my assignment I need to find out whether it will be affordable to buy a house in 20 years. It would be very beneficial for my assignment if I could get the data used in the line graph so that I can make my own line graph and make a line of best fit for my assignment to see where housing prices will be in 20 years
Hi Lachlan, thanks for reaching out.
You can find a link to the ABS with all of the data used in this article.
Alternatively, I’ve included it below for you:
https://www.abs.gov.au/statistics/economy/price-indexes-and-inflation/residential-property-price-indexes-eight-capital-cities/latest-release
Good to see long term trends. Do you have data on regional areas within the state?
Hi Peter, good question! We have not included regional property prices in our report. However, I’m sure the Australian Bureau of Statistics might have some data on this. I would suggest looking on their website.
Great post. I LOVE IT ALOT!!!!
Great article on the current state of house prices in Australia over the last decade! I found the information and data provided to be very informative and helpful in understanding the current market trends. I also appreciate the insight on the potential future of the housing market and the impact of government policies on the market. Keep up the excellent work!