We see tons of Winter forecasts each year. But how accurate are they really? The model accuracy is never consistent year to year but depends on several factors. As you will see, certain ocean anomalies, for example, can significantly raise the Winter forecast accuracy over the North Pacific and the surrounding countries, like the United States and Canada.
Many factors are coming together to influence the Winter season each year. The stronger they are, the more accurate the long-range model can be. Of course, depending on the type of influence, either atmospheric or oceanic.
First, we will quickly examine how weather forecasts are produced and how they work. Then we will look at some earlier Winter forecasts, comparing them to the actual analysis and revealing just how accurate they were.

WEATHER FORECASTING
To understand weather forecasts, we first must understand how the forecast is produced. It starts by understanding the global weather system.
In the image below, you can see the basic schematic of the Earth’s weather system. It s driven by the rotation of the Earth and uneven heating from the equator to the poles. The uneven heating also affects the pressure patterns and the jet stream.

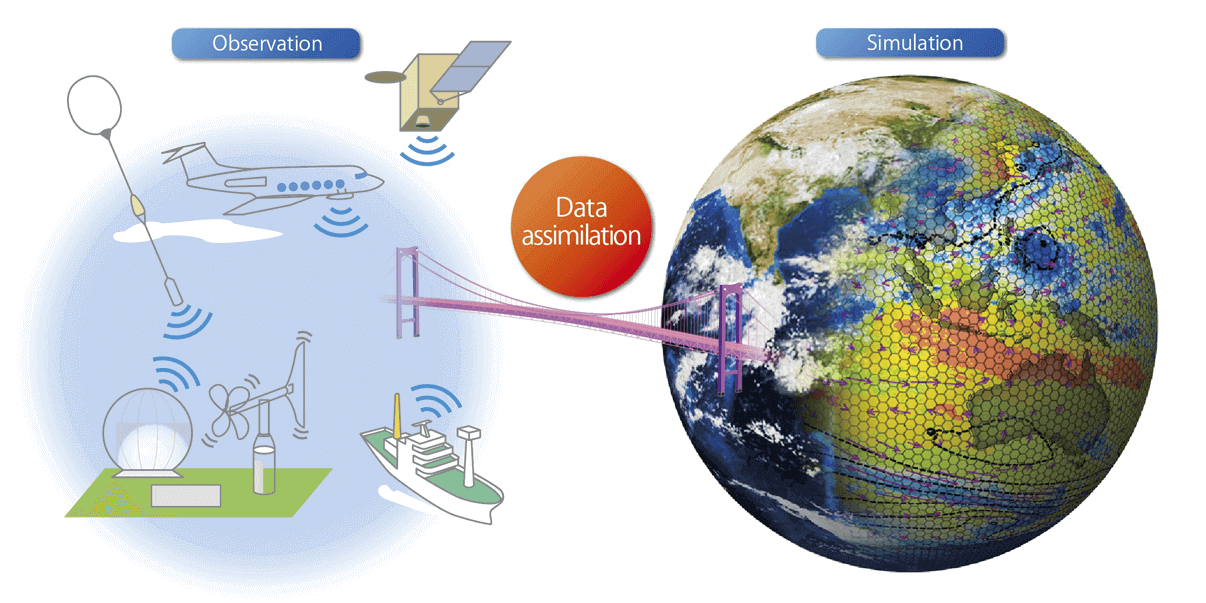
Knowing all this, we can observe the global weather system via various tools. We use satellite data, ship data, aircraft data, ground observations, weather balloons, radar data, etc. We can combine all these observations to create a real-time analysis.
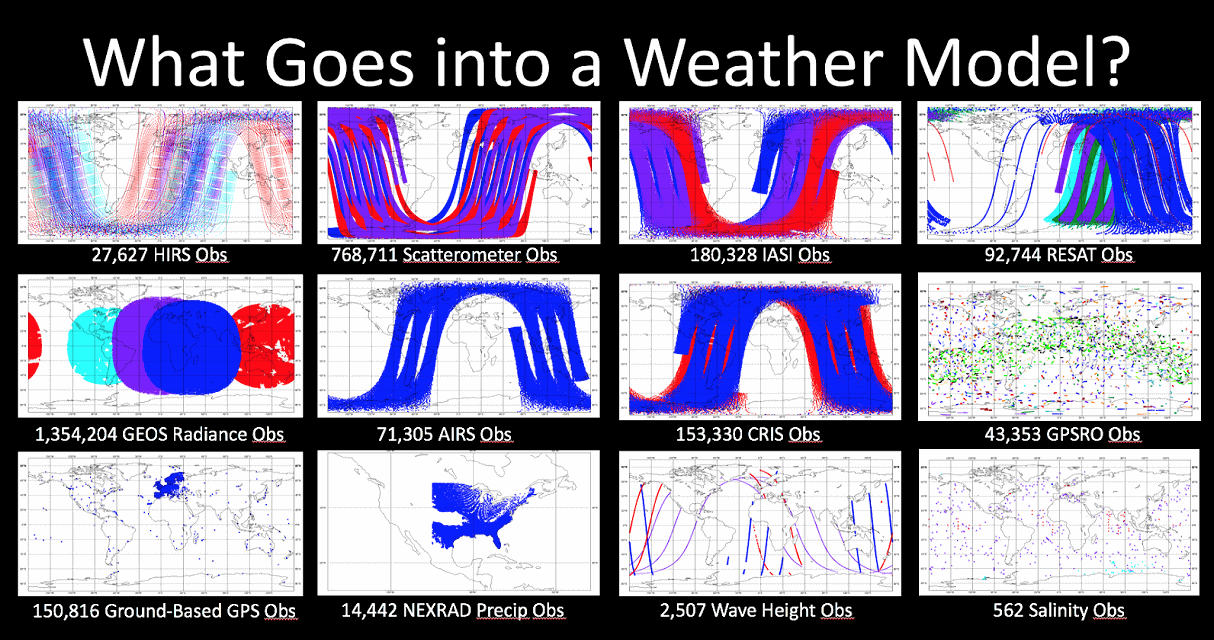
The process of gathering the observation data is called data assimilation. It is a crucial step in weather forecasting, as it produces a starting point from which the forecast is run. The higher the quality of the observation is, the better initial conditions we get and a better forecast.
After we have the initial data/analysis, the forecast begins. It is run in a 3D system, which calculates horizontal and vertical processes in a grid. It has to calculate all the motion, radiation, heat transfer, clouds, precipitation, ocean and ice effects, etc.
Here, the major drawback is produced. Each model has a certain resolution, meaning how many calculations points it has across the globe. A denser grid usually means better forecast, in theory at least, as the calculations are more dense and detailed.

But, a better resolution takes much more computer resources, so there is always a balance between performance and accuracy.
There are big differences between daily and long-range/seasonal forecasts. But generally, they all simulate weather over a certain period of time, using the laws of physics.
More specific for long-range forecasting is the ensemble system. Ensemble forecasting involves generating a collection of several forecasts with varying initial conditions for each forecast. Model parameters or physics can be the same or different depending on the forecast purpose.
Below is an example schematic of an ensemble forecast, where each individual forecast has slightly different starting/initial conditions. By doing this, we can observe the impact of changing initial conditions and cover many possibilities. Ensemble forecasting is sensitive to the data assimilation process and the quality of initial conditions.
The actual final forecast is usually the average of all the individual forecasts, especially for long-range forecasting. This way, we look for developing trends and deviations from normal, simulating the global weather system to try and detect its direction.
Usually, the direction of the global weather system can be dictated by so-called “climate drivers”. These can be the strong ocean or atmospheric anomalies that profoundly impact global circulation and pressure patterns.
One such driver, currently active, is the La Nina in the tropical Pacific. It is seen as a patch of cold ocean anomalies and is expected to last over the upcoming Winter season.
FROM THE OCEAN TO THE ATMOSPHERE
La Nina is the cold phase of the ENSO, short for “El Niño Southern Oscillation.” This region of the equatorial Pacific Ocean changes between warm and cold phases. Typically there is a phase change around every 1-3 years.
The cold phase is called La Nina, and the warm phase is called El Nino. We are currently in a La Nina phase, entering its 3rd year, which is a rather rare occurrence.
Below we have a close-up view of the tropical Pacific Ocean surface analysis. We can see the cold anomalies in the marked ENSO regions. The active La Nina is now entering its third-year phase, extending the cold ocean anomalies across most of the tropical Pacific.

The image below from NOAA Climate shows the typical circulation during a cold ENSO phase. Air sinks in the eastern Pacific, promoting stable and dry weather. At the same time, the air rises in the western Pacific, with lower pressure and more rainfall.

This way, ENSO significantly impacts the tropical rainfall and pressure patterns and thus impacts the ocean-atmosphere feedback system. Through this ocean-atmosphere system, the ENSO influence spreads globally.
La Nina forms during strong easterly trade winds, which can tell us much about the general state of global circulation. This way, we can use these anomalies as an “indicator” to know the current state of the global climate system.
Below, you can see the last two years of ocean anomalies in the ENSO region. You can see the first La Nina event in 2020 and a second-year La Nina in late 2021, lasting and impacting through the Winter, which we will analyze further below.

To better understand the ENSO development, we produced a video showing the ocean temperature anomalies from June to October 2022.
ENSO cooling restarted in August as the cold waves developed across the equatorial Pacific. But it picked up in September as the easterly trade winds intensified.
Historically, a strong blocking high-pressure system in the North Pacific is the most typical effect of a cold ENSO phase (La Nina). That usually redirects the polar jet stream down over the northern United States.
The image below shows the average pressure pattern during the La Nina winters in the past 40 years. You can see a strong high-pressure system in the North Pacific and a low-pressure area over Canada and the northern United States. Images by ;NOAA Physical Sciences Laboratory (PSL).

This is an important image, as we will use this to find any significant forecast skill, thanks to the active La Nina phase.
LONG-RANGE MODEL FORECAST SKILL
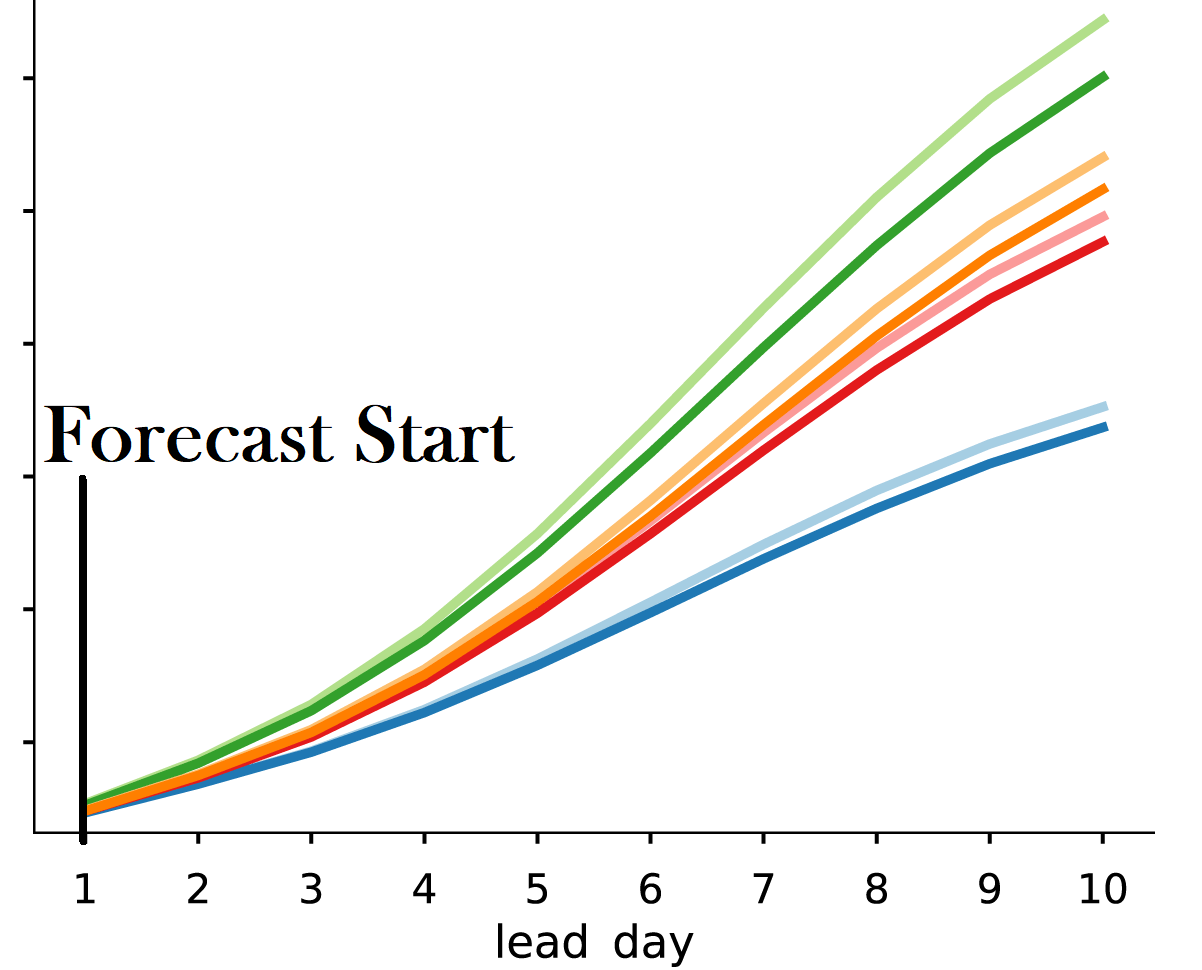
The best way to look at the accuracy of long-range forecasts is by combining decades of data and comparing it to the actual outcome. When we compare the forecast and the actual analysis, we can calculate a skill score.
Simplified, it can tell us generally how good a certain forecast is as the lead time increases. The higher score means a better forecast, with 1 meaning the best forecast accuracy.
The image below shows the skill score for the ENSO forecast from the ECMWF model. It shows good accuracy up to 3-4 months ahead for the forecasts released in November. But going more than 4 months ahead, the accuracy drops really fast, making it almost unusable over 6 months in advance, even for trends.

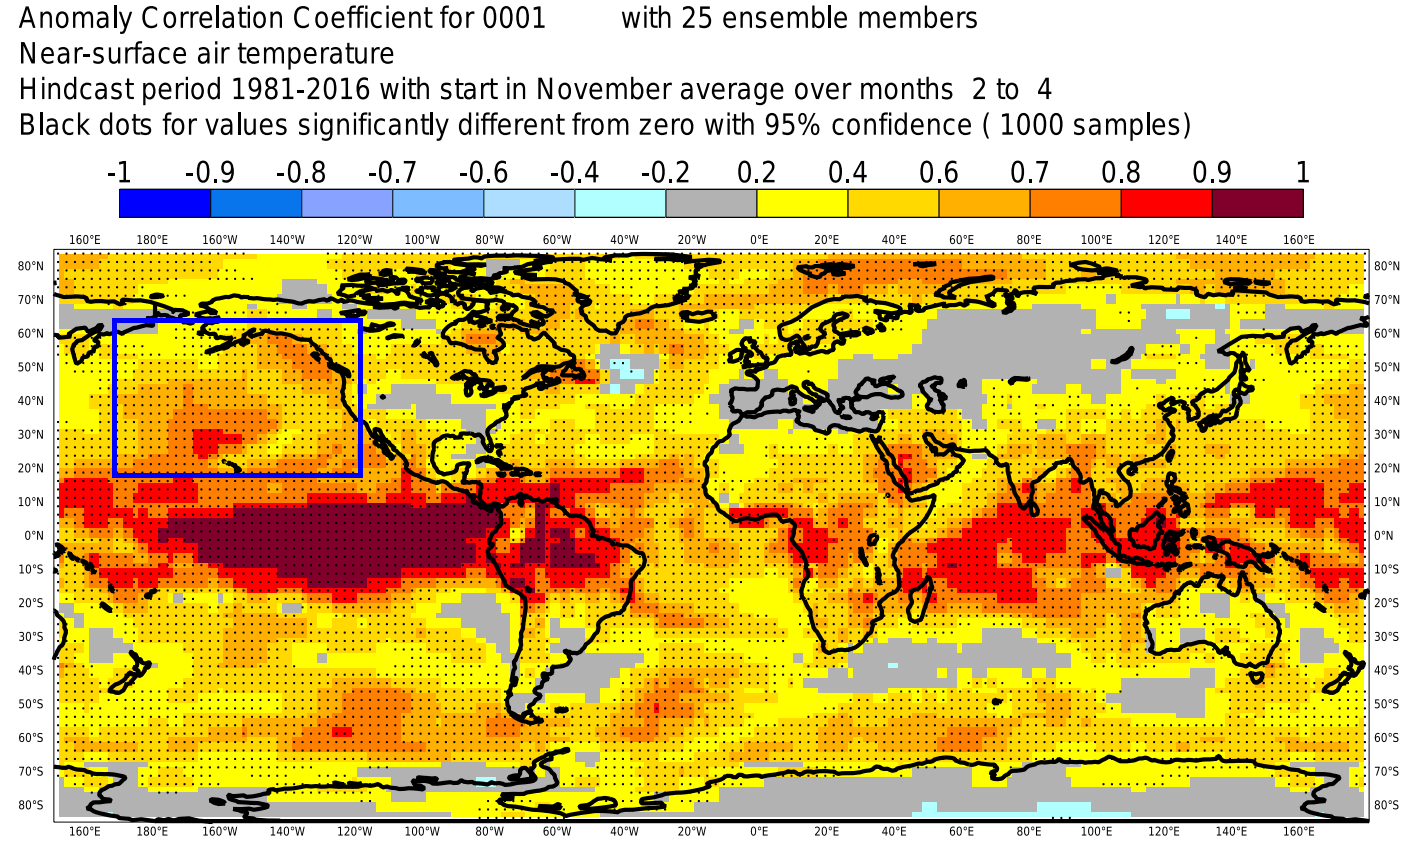
But we can also look at actual maps for other parameters, like pressure or temperature. Below are several images showing the anomaly correlation for the Winter periods (December-February) spanning from 1981 to 2016. This is for the forecasts released in the month of November.
The idea behind it is pretty much similar to a skill score. 1 means a perfect forecast, while negative values actually mean an opposite outcome when compared to the forecast. Looking at the pressure below, we can see a perfect score over the tropics. There are no fronts and strong pressure systems in the tropics, so it is much easier to forecast in that region.

Over the mid-latitudes, you can see a pretty bad score over Europe. But there is an area of good accuracy in the North Pacific related to the ENSO effects. That also creates a good accuracy over the United States and Canada, as the accuracy translates better into surrounding regions.
Looking at the surface temperature below, we can again see a very accurate forecast in the ENSO regions. Good accuracy then also translates into the North Pacific. While Europe and the central/eastern United States have low accuracy, better accuracy can be seen over the southwestern and northern United States and Canada.
Below we have the Winter precipitation forecast accuracy. This is one of the harder parameters to forecast, as it can be very local with peaks. But thanks to the good accuracy in the ENSO regions, we can see fairly good forecasts in the southern United States.

Overall, we can see that this long-range model has moderate to good accuracy over the regions closer to the forcing source. That source is most often from the Pacific ENSO region, which we mentioned above.
So how about comparing the forecast and analysis for an actual Winter season?
WINTER FORECAST VERSUS ACTUAL CONDITIONS
The graphics in the previous segment are an average over almost four decades. But for practical purposes, we will now compare the seasonal forecast for last winter, 2021/2022, with the actual conditions to see how close (or far off) it was.
We will look at one parameter at a time, so the comparison will always be direct. First, we will show the analysis and then the forecast. Two forecasts will be shown: the early one from September data and the more “fresh” one from November.
Remember that the more recent forecast is typically always better, as it has better starting conditions. Also, it tends to have more defined anomalies due to a shorter lead time.
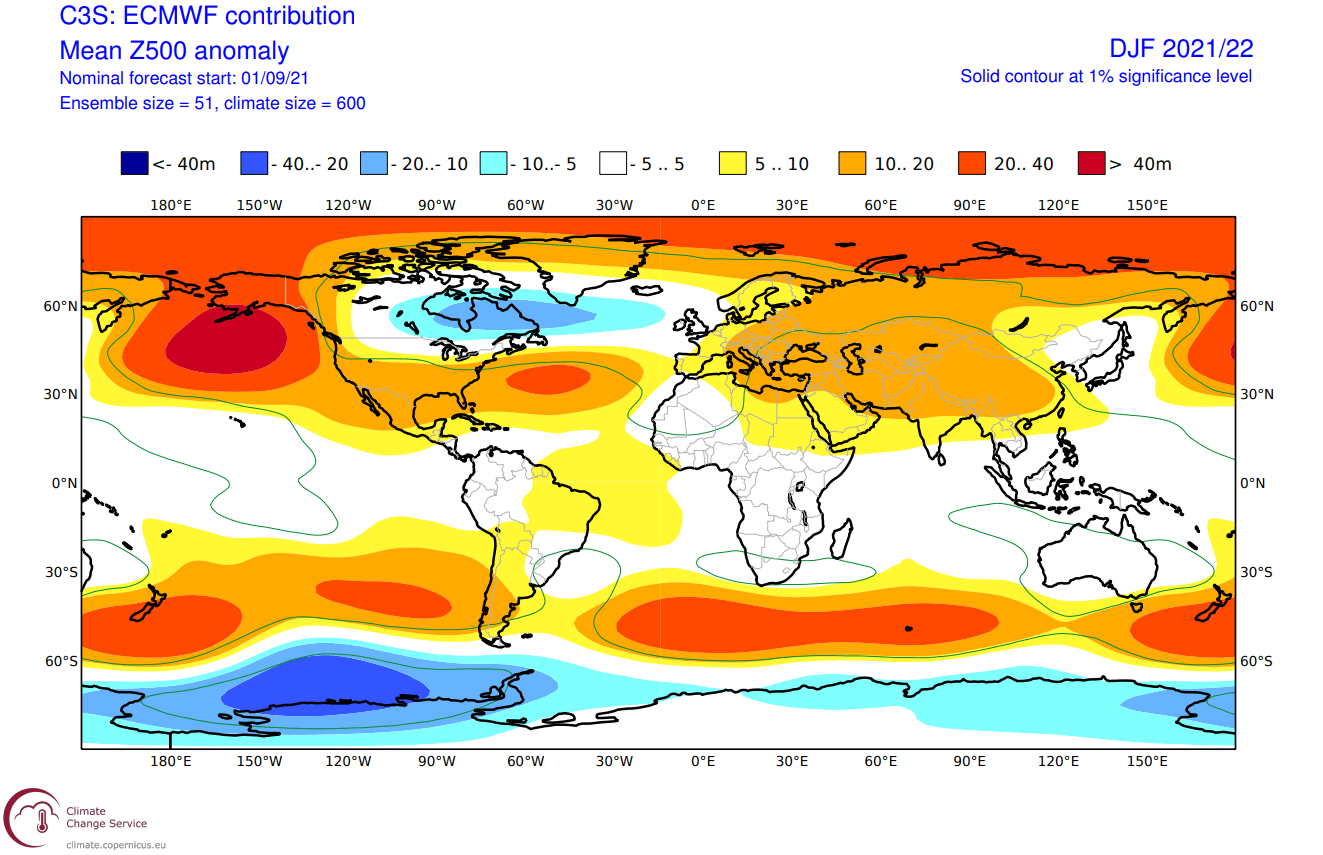
Starting off with the basics, we have the main pressure pattern. This shows us the geopotential height anomalies and how the jet stream behaves. It basically drives the Winter temperature and pressure patterns.
Looking at the analysis first, we can see a large and strong high-pressure anomaly in the North Pacific. That is the high-pressure zone from the La Nina influence. That promotes a low-pressure response over Canada and the northern United States but to various extents.

Over Europe, we see a strong high-pressure anomaly over western Europe and a low-pressure anomaly over the north/northeast.
Looking at the early forecast, released in September, you can see that the high-pressure anomaly in the North Pacific was very well forecast. Also, the low pressure over central/eastern Canada was nicely forecast. Europe had no strongly defined pressure zones compared to the actual analysis.
The later forecast in November also had a very good idea of the high-pressure anomaly in the North Pacific and the low pressure over Canada. But compared to the early forecast, it was further west with the low pressure. Also, it had a low-pressure tendency over western Europe, which is almost opposite to the actual conditions.
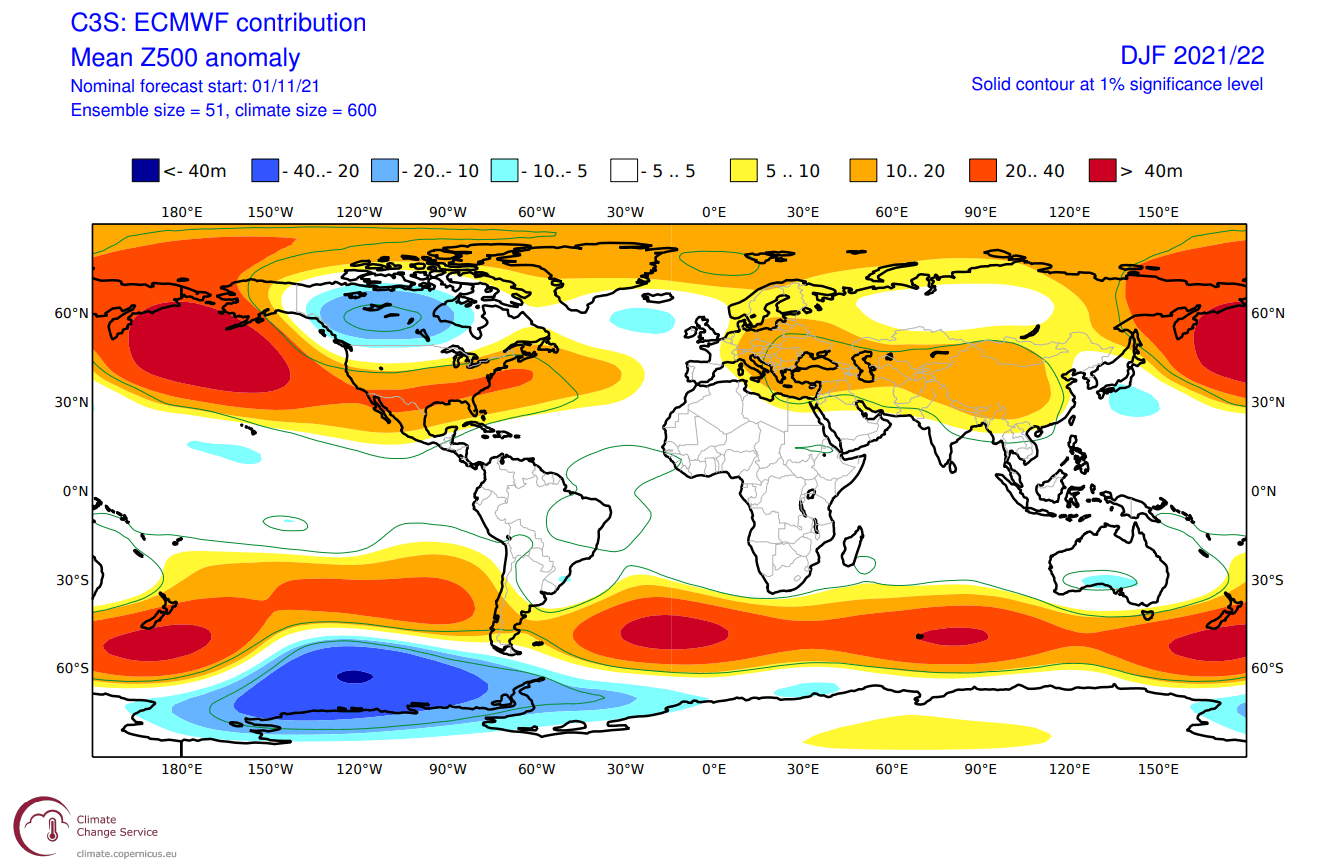
Overall, the early forecast perhaps had a better idea over North America and less “missed” forecast over Europe. While the November forecast had a better idea of the strength of the pressure systems over North America, the early forecast had a better spatial forecast.
TEMPERATURE VERIFICATION
Going to temperature, we have the Winter temperature analysis for Europe. It is quite straightforward. Most of the continent was warmer than normal, except the far northern parts.

The late forecast showed that most of the continent was warmer than normal. There was a hint of normal temperatures in far northern Europe and over the west/central parts. Overall it was not a bad forecast, given the lack of skill in the pressure pattern.

Going over the United State and Canada, the WInter analysis shows most of the central and southern United States was warmer than normal, especially in the southeast. But cold anomalies were present over the northwestern United States, parts of the upper Midwest, and southern Canada.

The early forecast hinted at something in Canada and the parts of the Midwest and northeastern United States. There were no cold anomalies in the forecast, but the pattern and the lack of warm anomalies do usually hint at colder air emerging in later forecasts. The southern end of the United States was well forecast to be warmer.

We can see that below in the November forecast. A cold pool was forecast in western Canada, with a transition zone extending into the northwestern United States and the upper Midwest. Warmer anomalies were forecast over the rest of the United States.

Looking again at the more detailed temperature analysis for the United States, we can see a colder winter was over the upper Midwest and parts of the northwestern United States. Warmer than normal winter was over much of the south-central states and the southeast.
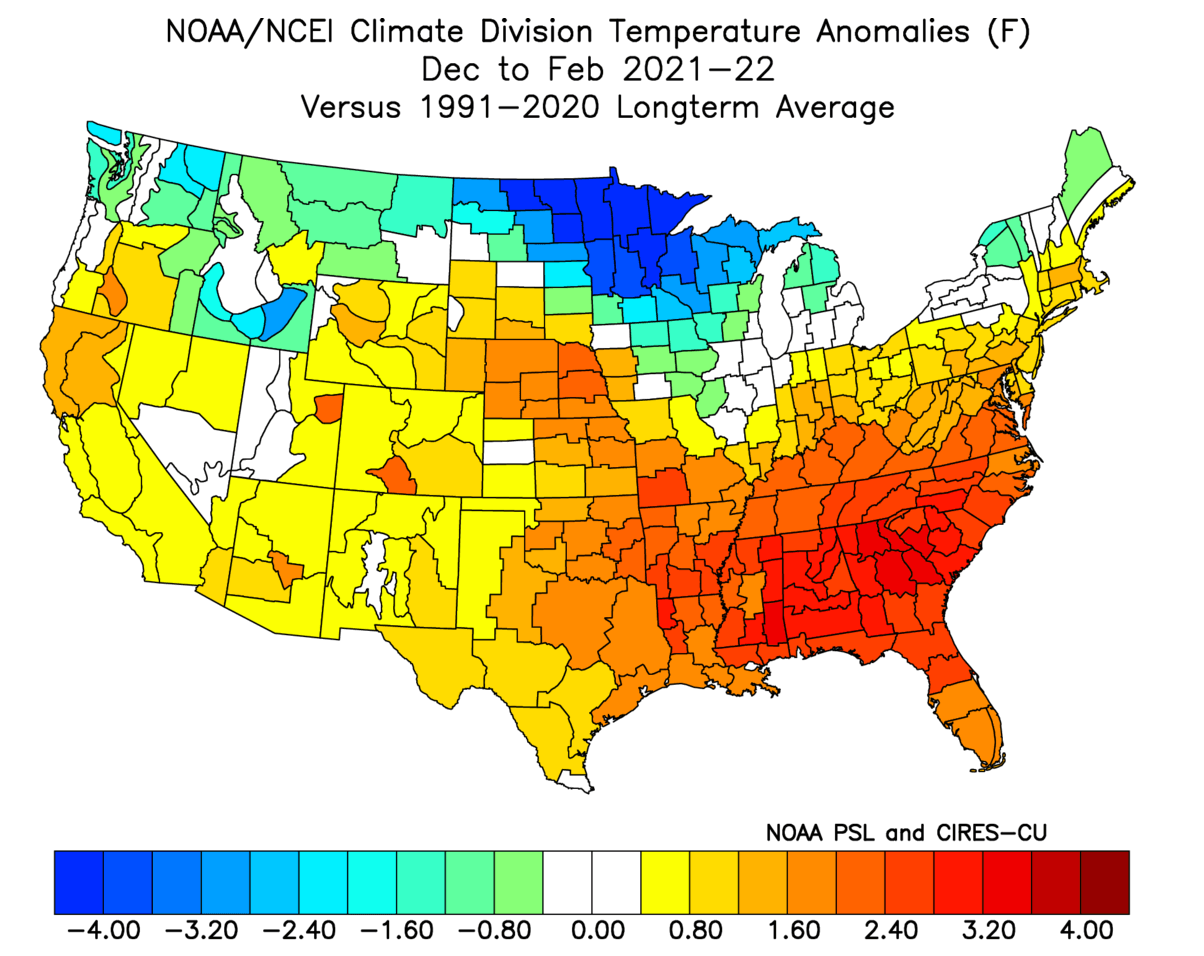
Comparing both forecasts, both lacked proper cold anomalies in the upper Midwest and in the northwestern United States. But they did get the pattern right. And also properly hinted at a warmer-than-normal winter overall in the southern parts of the United States.
PRECIPITATION VERIFICATION
The precipitation pattern over Europe was mostly divided into wetter north and drier south. More specifically, we can see more precipitation also over the central parts and drier towards the west and south.

The late winter forecast was somewhat correct in showing more precipitation in parts of central and northern Europe. But was totally off in the southern and western parts. So overall, it was more of a random forecast rather than having a fixed pattern like over North America.

Speaking of North America, you can see the Winter precipitation anomaly analysis. More precipitation was over the Ohio River Valley and up into the Great Lakes and southern Canada. Mostly drier conditions prevailed over the south-central and southeastern United States, but also over the Pacific Northwest.

The early forecast showed more precipitation over southern Canada and the Ohio River Valley, which was correct. It also forecasts less precipitation over the south-central United States. But it was showing too much precipitation over the northwestern United States.

The late forecast was mostly similar, with not much improvement. It even showed more precipitation in the northwestern United States and less in the east. It did, however, show more defined drier conditions in the south.

Looking at the more detailed analysis by NOAA, we can see much wetter conditions over the Ohio River Valley and more precipitation over the upper Midwest. But most of the western and southern United States was drier than normal.

Overall, the anomaly distribution was good from both forecasts, early and late, but the problem was the amount of precipitation, especially with too much in the west and too little in the east.
SNOWFALL VERIFICATION
Of course, we also have to look at the snowfall forecast. But given the poor precipitation forecast over Europe, we will only look at North America.
Looking at the actual anomalies, we can see more snowfall, mostly in small portions or swaths. Southern Canada stands out, as do parts of the northwestern United States, the upper Midwest, and parts of the eastern United States.

The ECMWF snow depth anomaly forecast called for more snowfall (blue-dark) in the western United States, going across into the Midwest and the northeast. The forecast showed too much snowfall over the western United States and too little over southern Canada. Interestingly, it correctly showed a swath of snowfall over Texas.

Overall, snowfall is harder to predict, as it is a combination of both temperature and precipitation. Usually, the bigger problem is with nailing the precipitation patterns, as temperature anomalies and cold outbreaks are more widespread.
But how does the latest forecast look for the upcoming Winter 2022/2023?
ECMWF WINTER SEASON FORECAST UPDATE
The latest updated winter pressure forecast from ECMWF below shows the La Nina high-pressure system in the North Pacific, extending to the western United States. A low-pressure anomaly is again forecast over western Canada, bringing the jet stream into the northern United States.

You can see the North Atlantic in a weak negative North Atlantic Oscillation (NAO) mode. Also, a low-pressure area over southwestern Europe and the Azores opens several different pattern variations throughout Winter.
We see a weak pattern in the surface temperature probability forecast over Europe. Most of the central and western continent is in the average temperature range. A higher probability of warmer than average temperatures is over the southern and northern regions.
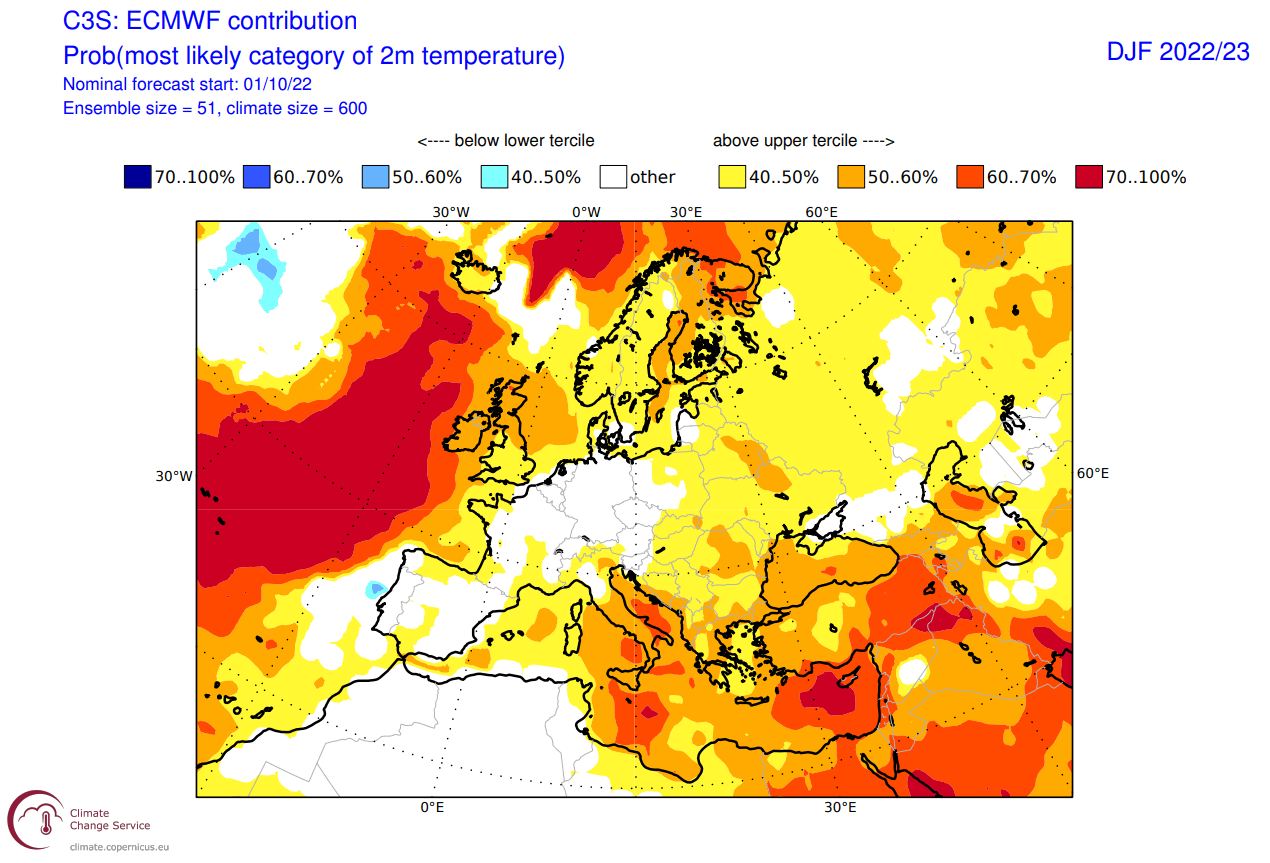
Over Noth America, the latest ECMWF forecast shows average to colder surface temperatures over most of western Canada, extending into parts of the northern United States. Warmer than normal temperatures are forecast over the southern United States, with a weaker anomaly going toward the northeast.

A negative NAO usually means a more northerly flow over the Midwest and the eastern United States. We have seen this development in the past in La Nina winters.
In this forecast, we do see a hint of weaker probabilities for warmer anomalies in the northern United States. But it is not yet clear how much of it is due to the negative NAO signal. That will be more clear in future updates.
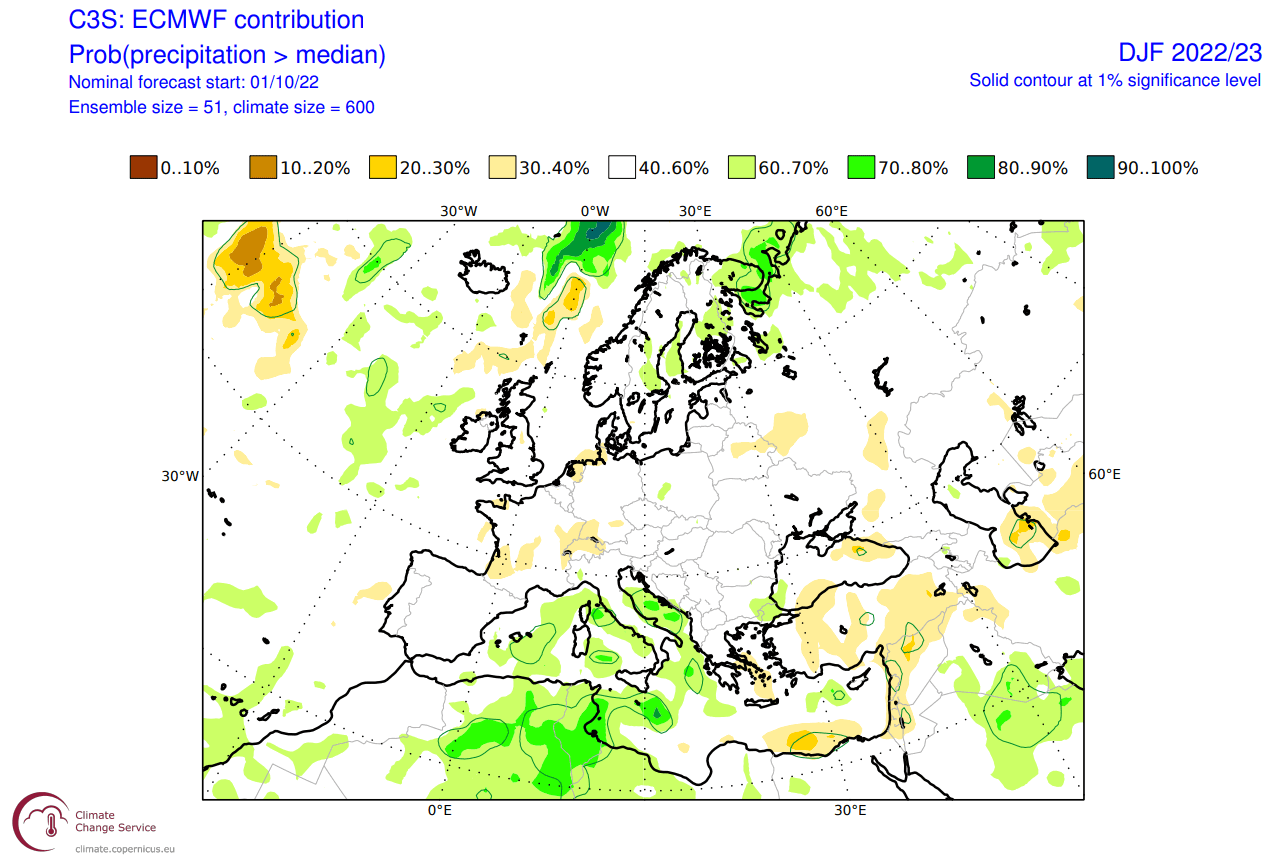
Looking at the precipitation forecast, we can see Europe having a mostly average precipitation signal, with some drier areas in the west-central parts. More precipitation is forecast over the southern and far northern Europe.
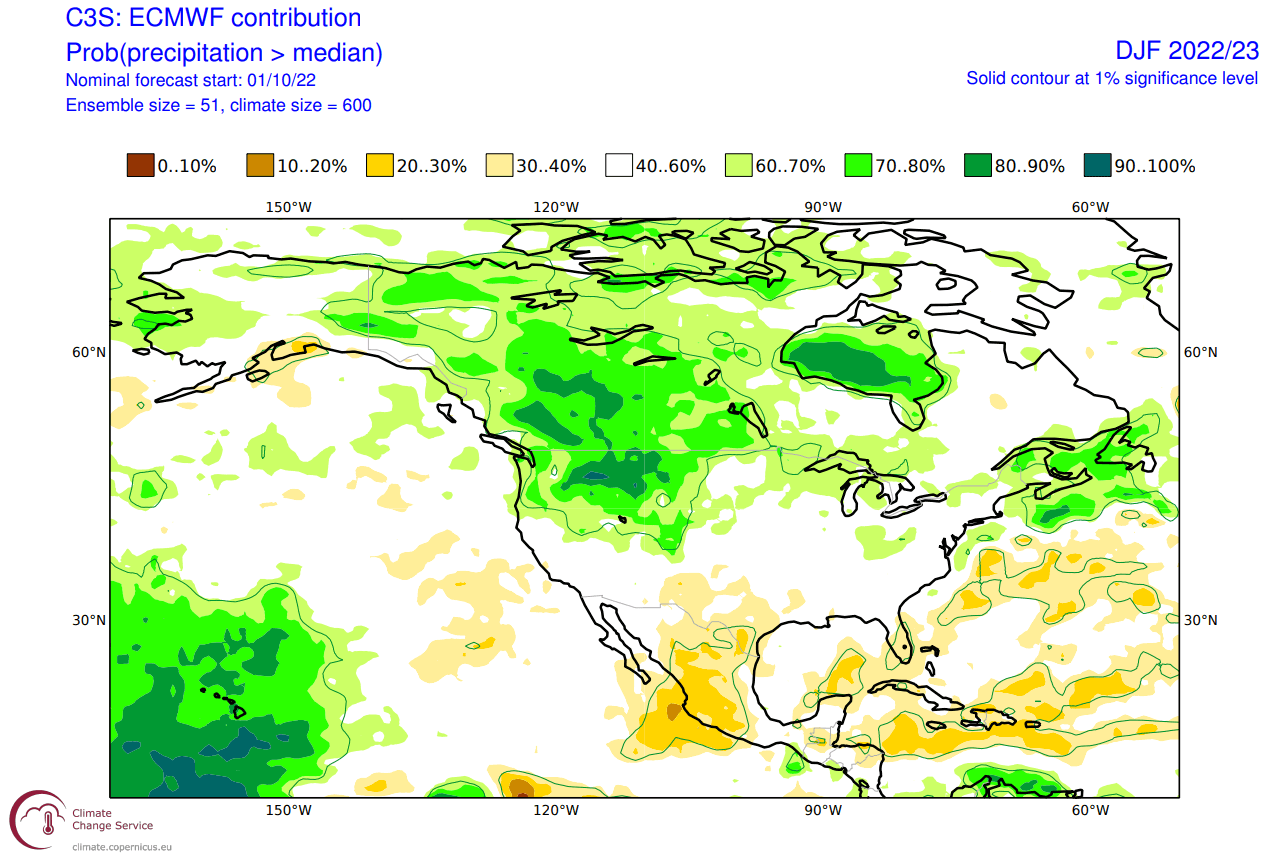
The precipitation anomaly forecast for North America shows a more typical La Nina-type pattern over Canada and the United States. More precipitation is forecast over Canada and the northwestern and northeastern United States. Drier conditions remain over the south-central United States, as usually seen in a La Nina pattern.
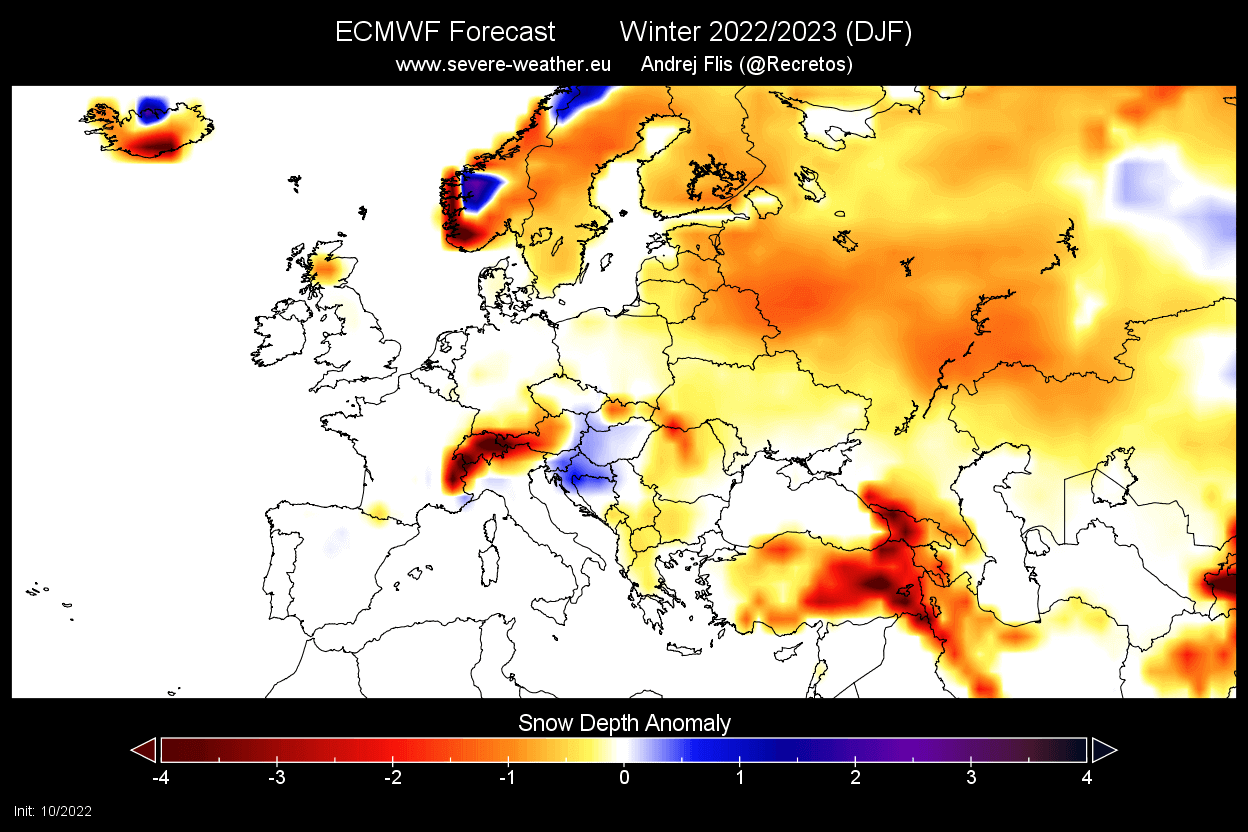
ECMWF WINTER 2022/2023 SNOWFALL FORECAST
We produced a special snowfall forecast from the ECMWF data provided by the Copernicus-EU project. Over Europe, we see primarily below-average snowfall, which is somewhat surprising given the lack of strong warm anomalies and normal precipitation. An increased snowfall potential is over small parts of central Europe.
Over North America, most of the country has below-average snow accumulation, except for the northwest and upper Midwest. Keep in mind that less snowfall than average does not equal no snowfall. So there can still be snowfall despite the forecast showing less snowfall than normal.

We will release a special forecast article dedicated to snowfall predictions. There, we will take a more in-depth look at snowfall potential, including more models and a month-by-month breakdown.
We will keep you updated on the developing weather trends in the coming seasons, so make sure to bookmark our page. Also, if you have seen this article in the Google App (Discover) feed, click the like button (♥) there to see more of our forecasts and our latest articles on weather and nature in general.