Flooded yet thirsty: Climate disaster and water access in Pakistan during 2022-2023
On 29 November and 2 December 2023, the Displacement Tracking Matrix (DTM) partnered with SOAS, University of London to host a two-day data workshop, “Storytelling through Data” to enhance students’ technical capacity with analysing humanitarian data. From their analysis, students were asked to weave together a coherent and captivating data story by creating an engaging and informative narrative, highlighting relevant data points based on their thematic focus and drawing correlations from the data.
This data story is written by the winning team – Maison Li, Shloka Murarka and Cameron Lambert – and describes their analysis, findings, and the story they extracted from the data.
Please note that this data story reflects the personal views and opinions of the authors, which may not necessarily be shared by the International Organization for Migration (IOM). IOM may not be held responsible for any use that may be made of the information contained in this data story, nor does the information imply expression of any opinion whatsoever concerning the legal status of any country, territory, city or area, or of its authorities, or concerning its frontiers or boundaries.
Access to water and sanitation is a human right, fundamental to everyone’s health and livelihood. Yet billions of people live without access to safe, clean water. Worryingly, we’re seeing the severe impact of climate change on water access for many communities around the world, as it intensifies droughts and floods.
In Pakistan, climate change poses a significant threat to water access. In the 1980s, Pakistan had a relatively abundant supply of water. However, Pakistan had become the 15th most water-stressed country in the world, and is predicted to become water scarce by 2035. In recent years, there have also been many climate-induced disasters in Pakistan, like the severe floods in 2022 that displaced 33 million people.
Water Stress, Top Countries (2020)
https://data.apps.foo.org/aquastat/?lang=en Download: https://doi.org/10.4060/cc816en-fig64
Given the consequences of climate change in Pakistan, we wanted to paint a picture of what water access for displaced individuals looks like after a major climate disaster. Using data from Round 1 and Round 2 of the Community Needs Identification (Flood Response) collected by IOM Displacement Tracking Matrix in Pakistan, analysis was done to understand how and where Temporarily Displaced Persons (TDPs) were getting their water. Were TDPs accessing water from freshwater sources? From centralised systems of aid? From national water infrastructure? Did this change over time? And what challenges did individuals face when accessing water?
METHODOLOGY
The data for Community Needs Identification (Flood Response) was collected between November – December 2022 for Round 1 and between January – March 2023 for Round 2. For a temporal understanding of how and where TDPs access water in post-flood Pakistan, we first used search terms to extract questions relating to water access from the data. We then split into two smaller groups, with one group working on Round 1 dataset and another group working on Round 2 dataset, finally pulling all our findings together in a shared Excel to compare the two time periods, making pivot tables and graphs as we went along. It is important to flag that a main limitation in the analysis was that we were not able to include Sindh, the province most impacted by the floods, in our findings. This is because of differences between Round 1 and Round 2 datasets. Although three provinces (Balochistan, Sindh, Khyber Pakhtunkhwa) were included in the first round of data, Sindh was not recorded in the second round. This means that our findings are only drawn from data gathered in Balochistan and Khyber Pakhtunkhwa provinces.
Number of TDPs from Round 1 (November – December 2022)
.png)
Number of TDPS from Round 2 (January – March 2023)
Moreover, Round 2 of data collection surveyed six additional areas in Khyber Pakhtunkhwa province that were not included in Round 1. Keeping in mind the different sample sizes, we use percentage-based comparisons to avoid any misrepresentations.
CHALLENGES
Initially, we found the breadth and size of the dataset intimidating. The datasets we looked at used a Cluster system, which meant that they offered a wide scope of information; protection services, available shelter, sanitation, and food are just a few of the indicators that DTM gathers responses on. Because of this, we struggled to narrow down our research focus. To agree what to focus on, we decided to listen to the data. Listening and focusing on a specific topic within the data, we looked at the responses gathered indicating the top 3 needs of TDPs by village and saw that clean and safe drinking water was a priority for many, so we decided that our research question would revolve around water access.
KEY FINDINGS
What percentage of villages considered water a top 3 need?

This graph shows that access to clean and safe drinking water was a priority need for TDPs in Pakistan, and remained so throughout both rounds of data collection. The second dataset shows that 37% of surveyed villages reported clean and safe water as one of their top 3 needs. This shows a 46% increase, rising by 13 percentage points since the first round, where 24% of villages reported it as a top 3 need. A quarter of people displaced needing water is a stark statistic itself, and the fact that this rose to over a third demonstrates the urgency of water access issues.
How many villages had access to functioning water taps?

This chart shows the percentage of villages that have access to water taps and whether they are functioning. The key takeaway is that the number of villages with access to mostly functioning taps were highly limited, both immediately after the flood (11%) and in the months after the flood (8%). This suggests a lack of reliable water infrastructure.
There are two factors at play here. First, the flooding took a huge toll on Pakistan’s water infrastructure, severely damaging half of all water facilities in the worst hit areas of Pakistan. Secondly, the data suggests a pre-existing lack of water infrastructure throughout the surveyed regions, since a large percentage of key informants responded that they never had access to taps.
Indeed, many communities throughout Pakistan face water-related issues like poor water supply, sanitation, wastewater and hygiene. Moreover, despite the country’s water system covering 92% of the population, only 36% of water supply was considered safe for consumption. Issues such as unsafe bacterial contamination and high levels of arsenic in water supplies was an issue prevalent even in pre-flood Pakistan.
High costs may be another factor in the low availability of taps. Some rural villages accessed water through untreated groundwater sources instead of incurring the high costs of an electricity-power water system. Revisiting the data, a limitation arises from a discrepancy between the two time periods of data. The chart above shows a substantial increase in the percentage of those that answered that taps ‘never existed’, from 29% in November – December 2022, to 57% in January – March 2023. Differences between the two rounds of data collection might explain this puzzling change. During the second round, the IOM surveyed six more districts in Khyber Pakhtunkhwa than the first round. The additional survey areas may contribute to the increase in the percentage of TDPs never having had access to a tap.
We included this in our analysis not only to highlight poor water infrastructure in Khyber Pakhtunkhwa that was not surveyed in the first round, but also to illustrate the limitations of the data collected.
How long did TDPs wait for water?

Looking at the availability of tap water tells us that most TDPs did not access water from taps. If this is the case, TDPs may have relied on water provided by aid organisations. This graph, showing a low average wait time for water, perhaps suggesting that TDPs have reliable access to water-related assistance throughout both rounds of data collection.
But looks can be deceiving, as we uncover by analysing how many TDPs received water aid and their primary sources of water.
From the villages who received assistance, who got help with water?

The most striking aspect of this graph is the very high percentage of TDPs that had not received any assistance: 82% in the first round, 50% in the second. Somewhat more promisingly, we also see a 32-percentage point increase of TDPs that received some form of assistance.
How does this picture change when we focus on water? Unfortunately, it becomes clear from the graph that water aid has not grown at the same rate as non-water assistance. This discouragingly suggests that, despite the lack of water infrastructure, water-related aid has been limited.
Is the lack of water assistance due certain difficulties delivering water aid? Or is it due to a failure to prioritise water as an essential need? We can’t answer these questions using the DTM datasets, but they’re worth further interrogation.
What were the top challenges TDPs faced when accessing water?

TDPs faced many challenges accessing water, which remained similar throughout both rounds of data collection. Water points being too far away was a consistent concern held by TDPs but was overtaken by complaints of poor quality or odorous water. Another lingering factor was the lack of water storage containers. The persistence of these issues demonstrates the human impact of unreliable water infrastructure and lack of water-related aid.
Where did TDPs collect drinking water from?

Earlier, when highlighting the short wait times for water, we hinted that there may be more than meets the eye. While the headline statistic of TDPs with no wait for water (47% in round 1 and 74% in round 2) suggests that water access is good, considering the source of that water is vital.
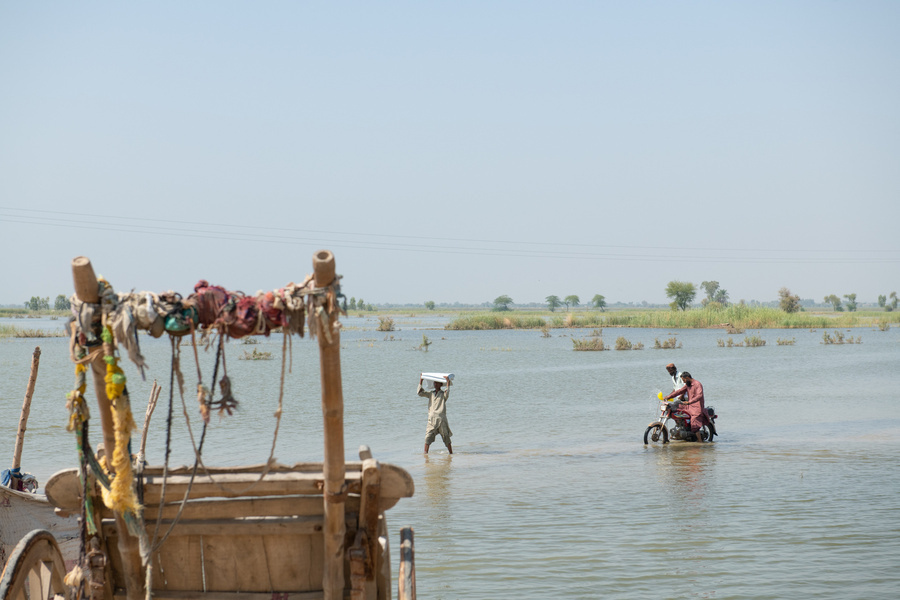
Lakes and ponds remained the top places where TDPs collected water, from 33% in the first round to 38% in the second, followed by rivers and streams, from 22% in the first to 28% in the second. This could explain why poor quality and odorous water was one of the main challenges that TDPs faced when accessing water. In a flood devastated region, open water sources are less likely to remain clean.
On the flip side, water trucking and bottles remained an uncommon way for TDPs to access water. In other words, the ways that TDPs collected water were not connected to centralised systems of aid. This remained consistent over both rounds of data collection.
This shows that many displaced individuals, lacking access to water infrastructure or an organised system of water aid, turned to any available source of water.
What percentage of TDPs collected drinking water from clean sources?

Grouping the data into ‘clean’ and ‘dirty’ water sources further highlights how few villages had access to clean, safe drinking water. Throughout both rounds of data collection, unclean water sources remained the most common place where TDPs collect water from. Accessing water through open or stagnant water sources had contributed to outbreaks of cholera, malaria and other waterborne diseases after the floods. Indeed, malaria comprised of 39% of primary health concerns of the villages surveyed in Jan-March 2023.
ANALYSIS
Overall, our data analysis shows that access clean and safe water is a major issue for individuals displaced by the 2022 floods in Pakistan.
Against a backdrop of poor access to water infrastructure and lack of water assistance, as well as challenges accessing water from centralised aid systems, many TDPs have been forced to access water from open and potentially unsafe sources – primarily lakes, streams, rivers, and ponds. These trends and challenges remained true throughout both rounds of data collection, from Nov 2022 to March 2023.
Clean and safe drinking water is a fundamental human right, yet one that those displaced by climate-induced disaster struggle to access. This urges us to ask – what climate-resilient solutions can we implement to secure water access for displaced people, as well as for future generations?
Participating Students

Shloka Murarka
Economics undergrad at SOAS specialising in informal labour markets in South Asia. Working with a feminist lens. Experience in the education sector, passionate about making economics more accessible.

Cameron Lambert
Global Development undergraduate at SOAS. Engaged by the political economy of labour and the environment. Has previously spent time working with the Wildlife Trust on community conservation projects.

Maison Li
Global Development student at SOAS specialising in development economics and climate change. Interested in environmental, economic and migration policy with previous experience in research and labour NGOs.