 |
|
|
|
|
|
|
| ||||||||||
|
|
|
|
|
|
|
||||
| ||||||||||
|
|
|
|
|
Persons using assistive technology might not be able to fully access information in this file. For assistance, please send e-mail to: [email protected]. Type 508 Accommodation and the title of the report in the subject line of e-mail. State-Specific Changes in Cholesterol Screening -- Behavioral Risk Factor Surveillance System, 1988-1991High blood cholesterol (HBC) is an important risk factor for coronary heart disease (1) -- the leading cause of death in the United States. To reduce the prevalence of elevated cholesterol levels in the United States, in 1985 the National Heart, Lung, and Blood Institute initiated the National Cholesterol Education Program (NCEP). The NCEP recommends that all adults aged greater than or equal to 20 years be screened for HBC at least once every 5 years. One of the national health objectives for the year 2000 is to increase to 75% the percentage of adults screened for HBC within the preceding 5 years (objective 15.14) (2). To measure progress toward this objective, data from CDC's Behavioral Risk Factor Surveillance System (BRFSS) were used to examine state-specific trends in cholesterol screening from 1988 through 1991. This report summarizes the results of this analysis and provides a projected estimate of the 1994 screening rates for HBC in each state. Data were available for 258,782 persons aged greater than or equal to 20 years in 47 states and the District of Columbia who participated in the BRFSS, a population-based, random-digit-dialed telephone survey. However, only 37 states participated continuously for all 4 years. Respondents were asked whether they had ever had their cholesterol checked, and if so, the length of time that had elapsed since they last had their cholesterol checked. Persons who reported that they had been screened within the preceding 5 years were classified as having been screened for HBC. Data were weighted to account for the age, race, and sex distribution in each state. To allow for comparisons between states, the results were standardized for age, race, sex, and level of education and adjusted to the 1980 U.S. population. Confidence intervals for the prevalence estimates were calculated using SESUDAAN (3). A state-specific method and an aggregate method were used to project the prevalence of cholesterol screening in 1994. The analysis in the state-specific method was limited to the 37 states that participated in the BRFSS from 1988 through 1991; for each state, the 3-year change in the percentage of adults screened for HBC during 1988-1991 was added to that state's 1991 value to project the 1994 screening rate. The analysis in the aggregate method employed the median 3-year change in cholesterol screening from 1988 through 1991 from the 37 states that participated in the BRFSS; the median 3-year change was then added to the state-specific 1991 cholesterol screening value for each of the 48 states. In the 37 states that participated in the BRFSS from 1988 through 1991, the percentage of adults screened for HBC increased from 51.2% to 63.9% (Table_1). The estimated state-specific 3-year change in the rate of cholesterol screening ranged from a 2.0% increase in Hawaii to a 21.4% increase in New Mexico (median: 12.7%). Based on the state-specific method of analysis, the projected screening rates for 1994 ranged from 63.6% (Illinois) to 86.4% (Connecticut); 20 (54.1%) of the 37 states have projected 1994 screening rates greater than the national year 2000 objective of 75%. Based on the median increase of 12.7%, the projected screening rates for 1994 ranged from 69.7% (New Mexico) to 82.2% (New Jersey). Using this method, 32 (66.7%) of the 48 states would reach the national year 2000 objective by 1994 (Figure_1). Reported by the following BRFSS coordinators: L Eldridge, Alabama; P Owen, Alaska; J Contreras, Arizona; J Senner, Arkansas; L Lund, California; M Leff, Colorado; M Adams, Connecticut; F Breukelman, Delaware; C Mitchell, District of Columbia; D McTague, E Pledger, Florida; VF Ah Cook, Hawaii; J Mitten, Idaho; B Steiner, Illinois; R Guest, Indiana; S Schoon, Iowa; K Bramblett, Kentucky; S Kirkconnell, Louisiana; R Schwartz, Maine; A Weinstein, Maryland; R Lederman, Massachusetts; H McGee, Michigan; N Salem, Minnesota; E Jones, Mississippi; J Jackson-Thompson, Missouri; P Smith, Montana; S Huffman, Nebraska; K Zaso, New Hampshire; G Boeselager, New Jersey; L Pendley, New Mexico; C Baker, New York; CR Washington, North Carolina; M Maetzold, North Dakota; E Capwell, Ohio; N Hann, Oklahoma; J Grant-Worley, Oregon; C Becker, Pennsylvania; J Buechner, Rhode Island; M Lane, South Carolina; B Miller, South Dakota; D Ridings, Tennessee; R Diamond, Texas; R Giles, Utah; P Brozicevic, Vermont; R Schaeffer, Virginia; T Jennings, Washington; F King, West Virginia; E Cautley, Wisconsin. P Remington, MD, Bur of Public Health, Div of Health, Wisconsin Dept of Health and Social Svcs. Cardiovascular Health Br, Div of Chronic Disease Control and Community Intervention, National Center for Chronic Disease Prevention and Health Promotion, CDC. Editorial NoteEditorial Note: For persons with cholesterol levels in the highest 10% of the U.S. population, the risk of dying from coronary heart disease is approximately fourfold greater than that for persons with levels in the lowest 10% (4). Based on NCEP guidelines, approximately 29% of U.S. adults need treatment for HBC (5). The findings in this report indicate substantial increases in cholesterol screening from 1988 through 1991, representing an additional 19 million adults aged greater than or equal to 20 years who have been screened for HBC. This increase may be attributable to a variety of factors, including increased public interest in cholesterol, the increased quantity and quality of screening services (6), and educational efforts sponsored by public and private agencies. Based on either the state-specific or aggregate trends methods of projection, if current trends continue, by 1994 populations in one half of the states will attain the national year 2000 objective for cholesterol screening. In addition, data from the third National Health and Nutrition Examination Survey, conducted from 1988 through 1991, indicate that the national year 2000 objectives for two other cholesterol-related health objectives -- the prevalences of high blood cholesterol and mean cholesterol level (7) -- are close to being achieved. Screening is an important step in reducing the prevalence of elevated cholesterol levels. Other steps include increasing public awareness of the health risk associated with HBC, adopting appropriate dietary changes to reduce fat and cholesterol intake, reducing weight for persons who are overweight, and increasing physical activity (8). Periodic analysis of data from the BRFSS will assist in monitoring state-specific progress toward achieving the national year 2000 objectives for cholesterol screening and guiding the development of new objectives. References
     TABLE 1. State-specific changes in the percentage of adults who have had their cholesterol checked within the preceding
     5 years -- Behavioral Risk Factor Surveillance System, 1988-1991
====================================================================================================================================================
                                                                                                       Projected                    Projected
                                                                                Change            1994 screening rate          1994 screening rate
                                                                           in screening rate,    based on the 1988-1991         based on a 12.7%
     State                  1988 *      1989 +      1990 &      1991 @        1988-1991 **       state-specific increase ++      median increase &&
     ----------------------------------------------------------------------------------------------------------------------------------------------
     Alabama                47.3        48.0        56.5        63.9            16.6 @@                  80.5 ***                     76.6 ***
     Alaska                  NA +++      NA          NA         62.4             NA                       NA                          75.1 ***
     Arizona                51.7        55.7        56.1        62.4            10.7 @@                  73.1                         75.1 ***
     Arkansas                NA          NA          NA         58.5             NA                       NA
     California             53.4        60.0        59.2        65.7            12.3 @@                  78.0 ***                     78.4 ***
     Colorado                NA          NA         60.4        62.1             NA                       NA                          74.8
     Connecticut            51.4        62.1        65.4        68.9            17.5 @@                  86.4 ***                     81.6 ***
     Delaware                NA          NA         61.4        62.6             NA                       NA                          75.3 ***
     District of Columbia   58.4        46.7        50.0        62.4             4.0                     66.4                         75.1 ***
     Florida                51.2        56.1        62.2        67.7            16.5                     84.2 ***                     80.4 ***
     Georgia                49.4        54.4        62.3        64.3            14.9 @@                  79.2 ***                     77.0 ***
     Hawaii                 61.2        53.8        64.3        63.2             2.0                     65.2                         75.9 ***
     Idaho                  50.1        54.3        56.1        60.9            10.8 @@                  71.7                         73.6
     Illinois               51.6        55.9        59.1        57.6             6.0                     63.6                         70.3
     Indiana                48.9        49.9        57.2        61.2            12.3 @@                  73.5                         73.9
     Iowa                   51.7        55.4        62.8        64.6            12.9 @@                  77.5 ***                     77.3 ***
     Kentucky               47.6        52.5        54.6        59.4            11.8 @@                  71.2                         72.1
     Louisiana               NA          NA         62.0        61.7             NA                       NA                          74.4
     Maine                  55.9        57.8        64.5        64.5             8.6 @@                  73.1                         77.2 ***
     Maryland               54.2        63.3        64.0        66.8            12.6 @@                  79.4                         79.5 ***
     Massachusetts          52.2        59.1        64.2        66.8            14.6 @@                  81.4 ***                     79.5 ***
     Michigan               57.9        59.3        61.5        65.8             7.9 @@                  73.7                         78.5 ***
     Minnesota              52.2        57.9        61.4        65.1            12.9 @@                  78.0 ***                     77.8 ***
     Mississippi             NA          NA         51.7        59.1             NA                       NA                          71.8
     Missouri               44.0        48.1        59.1        63.6            19.6 @@                  83.2 **                      76.3 ***
     Montana                47.0        48.9        52.8        59.3            12.3 @@                  71.6                         72.0
     Nebraska               47.7        50.5        55.5        60.4            12.7 @@                  73.1                         73.1
     New Hampshire          54.0        56.6        58.5        69.0            15.0 @@                  84.0 ***                     81.7 ***
     New Jersey              NA          NA          NA         69.5             NA                       NA                          82.2 ***
     New Mexico             35.6        47.4        54.3        57.0            21.4 @@                  78.4 ***                     69.7
     New York               51.8        52.5        63.5        66.1            14.3 @@                  80.4 ***                     78.8 ***
     North Carolina         54.9        55.2        64.7        67.5            12.6 @@                  80.1 ***                     80.2 ***
     North Dakota           50.1        53.7        62.2        62.1            12.0 @@                  74.1                         74.8
     Ohio                   46.7        51.3        54.6        63.3            16.6 @@                  79.9 ***                     76.0 ***
     Oklahoma               51.0        52.5        63.0        64.6            13.6 @@                  78.2 ***                     77.3 ***
     Oregon                  NA         58.6        61.8        64.8             NA                       NA                          77.5 ***
     Pennsylvania            NA         55.2        58.8        62.6             NA                       NA                          75.3 ***
     Rhode Island           51.2        59.5        67.3        68.1            16.9 @@                  85.0 ***                     80.8 ***
     South Carolina         52.8        58.3        63.2        66.1            13.3 @@                  79.4 ***                     78.8 ***
     South Dakota           45.6        51.8        51.9        61.7            16.1 @@                  77.8 ***                     74.4
     Tennessee              49.7        52.7        62.7        64.7            15.0 @@                  79.7 ***                     77.4 ***
     Texas                  48.9        56.6        59.1        62.6            13.7 @@                  76.3 ***                     75.3 ***
     Utah                   45.4        51.0        54.9        57.5            12.1 @@                  69.6                         70.2
     Vermont                 NA          NA         62.6        67.0             NA                       NA                          79.7 ***
     Virginia                NA         56.5        63.4        67.5             NA                       NA                          80.2 ***
     Washington             56.2        61.7        63.4        68.9            12.7 @@                  81.6 ***                     81.6 ***
     West Virginia          48.2        49.6        59.1        61.7            13.5 @@                  75.2 ***                     74.4
     Wisconsin              49.1        56.1        61.1        61.8            12.7 @@                  74.5                         74.5

     No. of states
       meeting national
       health objective
       for year 2000         0           0           0           0               NA                   20/37 (54%)                  32/48 (67%)
     ----------------------------------------------------------------------------------------------------------------------------------------------
       * Sample sizes for individual states range from 609 to 3056 persons aged >=20 years.
       + Sample sizes for individual states range from 667 to 3180 persons aged >=20 years.
       & Sample sizes for individual states range from 727 to 3191 persons aged >=20 years.
       @ Sample sizes for individual states range from 670 to 3190 persons aged >=20 years.
      ** 1991 percentage minus 1988 percentage.
      ++ Limited to the 37 states that collected cholesterol screening information from 1988 through 1991.
      && Aggregate increase is based on data from the 37 states that collected cholesterol screening information from 1988 through 1991.
      @@ Statistically significant increase from 1988 through 1991; p<O.05.
     *** Value meets the national year 2000 objective for cholesterol screening.
     +++ Not available.
====================================================================================================================================================
Return to top. Figure_1 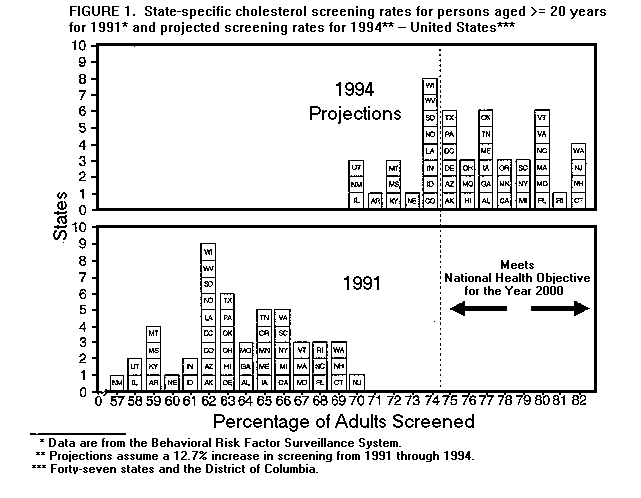 Return to top. Disclaimer All MMWR HTML versions of articles are electronic conversions from ASCII text into HTML. This conversion may have resulted in character translation or format errors in the HTML version. Users should not rely on this HTML document, but are referred to the electronic PDF version and/or the original MMWR paper copy for the official text, figures, and tables. An original paper copy of this issue can be obtained from the Superintendent of Documents, U.S. Government Printing Office (GPO), Washington, DC 20402-9371; telephone: (202) 512-1800. Contact GPO for current prices. **Questions or messages regarding errors in formatting should be addressed to [email protected].Page converted: 09/19/98 |
|||||||||
This page last reviewed 5/2/01
|