 |
|
|
|
|
|
|
| ||||||||||
|
|
|
|
|
|
|
||||
| ||||||||||
|
|
|
|
|
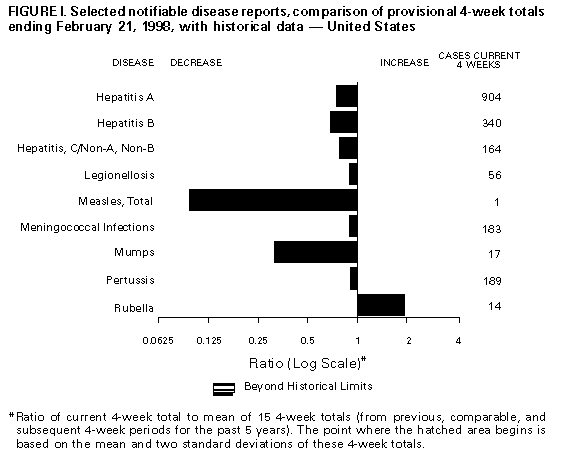
Persons using assistive technology might not be able to fully access information in this file. For assistance, please send e-mail to: [email protected]. Type 508 Accommodation and the title of the report in the subject line of e-mail. Notifiable Diseases/Deaths in Selected Cities Weekly InformationFigure_I Selected notifiable disease reports, comparison of provisional 4-week totals ending February 21, 1998, with historical data -- United States Table_I Summary -- provisional cases of selected notifiable diseases, United States, cumulative, week ending February 21, 1998 (7th Week) Table_II Provisional cases of selected notifiable diseases, United States, weeks ending February 21, 1998 and February 15, 1997 (7th Week) Table_III Provisional cases of selected notifiable diseases preventable by vaccination, United States, weeks ending February 21, 1998 and February 15, 1997 (7th Week) Table_IV Deaths in 122 U.S. cities, week ending
February 21, 1998 (7th Week)
TABLE I. Summary -- provisional cases of specified notifiable diseases, United
States, cumulative, week ending February 21, 1998 (7th Week)
==================================================================================
                                             Cum. 1998
------------------------------------------------------
Anthrax                                              -
Brucellosis                                          3
Cholera                                              -
Congenital rubella syndrome                          -
Cryptosporidiosis*                                 166
Diphtheria                                           -
Encephalitis:  California*                           2
               eastern equine*                       -
               St. Louis*                            -
               western equine*                       -
Hansen Disease                                       9
Hantavirus pulmonary syndrome*+                      -
Hemolytic uremic syndrome, post-diarrheal*           1
HIV infection, pediatric*&                          22
Plague                                               -
Poliomyelitis, paralytic@                            -
Psittacosis                                          6
Rabies, human                                        -
Rocky Mountain spotted fever (RMSF)                 10
Streptococcal disease, invasive Group A            198
Streptococcal toxic-shock syndrome*                 11
Syphilis, congenital**                               -
Tetanus                                              1
Toxic-shock syndrome                                10
Trichinosis                                          1
Typhoid fever                                       32
Yellow fever                                         -
------------------------------------------------------
-: no reported cases
 * Not notifiable in all states
 + Updated weekly from reports to the Division of Viral and Rickettsial
   Diseases, National Center for Infectious Diseases (NCID).
 & Updated monthly to the Division of HIV/AIDS Prevention -- Surveillance
   and Epidemiology, National Center for HIV, STD, and TB Prevention
   (NCHSTP), last update January 25, 1998.
 @ One suspected case(s) of polio with onset in 1998 have also been reported
   to date.
** Updated from reports to the Division of STD Prevention, NCHSTP.

==================================================================================
Return to top. Table_II Note: To print large tables and graphs users may have to change their printer settings to landscape and use a small font size.
TABLE II. (page 1) Provisional cases of selected notifiable diseases, United States, weeks ending
February 21, 1998, and February 15, 1997 (7th Week)
Escherichia
coli O157:H7
------------------- Hepatitis
AIDS* Chlamydia NETSS** PHLIS*** Gonorrhea C\NA,NB
----------------- -------------------- -------- -------- ------------------- ----------------
Cum. Cum. Cum. Cum. Cum. Cum. Cum. Cum. Cum. Cum.
Reporting Area 1998 1997 1998 1997 1998 1998 1998 1997 1998 1997
------------------------------------------------------------------------------------------------------------------------------
UNITED STATES 3,171 7,045 52,657 53,918 83 33 34,830 35,585 243 337
NEW ENGLAND 64 201 2,516 2,252 9 6 732 790 1 6
Maine 2 13 139 109 - - 7 6 - -
N.H. - 1 104 113 2 2 16 34 - -
Vt. 5 7 36 54 - - 1 9 - -
Mass. 6 122 1,156 976 6 4 297 310 1 6
R.I. 12 26 343 266 1 - 46 71 - -
Conn. 39 32 738 734 - - 365 360 - -
MID. ATLANTIC 902 2,312 7,439 7,003 2 - 4,259 4,412 25 21
Upstate N.Y. 114 384 N N 2 - 198 673 23 12
N.Y. City 490 1,051 4,763 3,830 - - 2,238 1,820 - -
N.J. 135 572 119 1,421 - - 522 936 - -
Pa. 163 305 2,557 1,752 N - 1,301 983 2 9
E.N. CENTRAL 203 389 10,118 8,587 19 5 7,685 5,620 55 88
Ohio 32 93 3,211 2,862 6 - 1,987 1,928 3 4
Ind. 39 25 1,061 1,110 5 3 789 879 1 1
Ill. 102 115 2,427 1,464 7 - 2,078 707 2 14
Mich. 15 118 3,081 1,662 1 - 2,677 1,469 49 69
Wis. 15 38 338 1,489 N 3 154 637 - -
W.N. CENTRAL 55 188 3,411 3,851 7 3 1,312 1,702 6 16
Minn. 15 17 560 969 3 4 236 339 - -
Iowa 6 37 334 606 1 - 90 158 2 1
Mo. 19 112 1,344 1,284 - 1 531 857 4 10
N. Dak. - 2 1 120 - - 1 8 - 1
S. Dak. 4 - 224 124 - - 34 18 - -
Nebr. 9 13 77 218 1 - 13 66 - -
Kans. 2 7 871 530 2 - 407 256 - 4
S. ATLANTIC 793 2,043 12,129 10,233 16 2 10,547 10,930 16 23
Del. 13 20 295 - - - 204 146 - -
Md. 53 308 959 649 8 1 1,066 1,606 2 3
D.C. 83 120 N N - - 443 686 - -
Va. 39 132 1,640 1,384 N 1 940 1,153 1 1
W. Va. 5 14 363 494 N - 105 150 - -
N.C. 45 60 2,544 2,502 4 - 2,228 2,240 5 8
S.C. 59 124 2,203 1,674 - - 1,633 1,671 - 9
Ga. 116 187 2,178 711 2 - 2,255 1,024 - -
Fla. 380 1,078 1,947 2,819 2 - 1,673 2,254 8 2
E.S. CENTRAL 156 187 4,756 4,176 4 2 4,943 4,643 13 33
Ky. 19 23 760 807 1 - 507 579 - -
Tenn. 52 109 1,777 1,474 1 2 1,638 1,374 11 14
Ala. 56 38 1,286 1,068 2 - 1,752 1,568 2 1
Miss. 29 17 933 827 - 1 1,046 1,122 - 18
W.S. CENTRAL 382 483 3,134 4,861 - - 2,759 3,838 - 22
Ark. 17 18 430 335 - - 736 585 - -
La. 67 126 1,674 760 - - 1,446 917 - 14
Okla. 14 32 1,030 738 - - 577 625 - -
Tex. 284 307 - 3,028 - - - 1,711 - 8
MOUNTAIN 88 183 2,480 2,726 8 5 1,006 948 75 45
Mont. 6 7 107 85 - - 6 6 4 3
Idaho 3 2 120 194 2 - 4 16 14 9
Wyo. - 5 109 61 - - 7 6 41 18
Colo. 21 39 - 168 1 1 391 274 3 5
N. Mex. 9 4 576 569 2 2 114 121 4 4
Ariz. 33 28 1,243 1,162 N 2 423 402 - 4
Utah 13 17 215 154 2 - 25 19 6 -
Nev. 3 81 110 333 1 - 36 104 3 2
PACIFIC 528 1,059 6,674 10,229 18 9 1,587 2,702 52 83
Wash. 34 45 1,423 1,194 1 3 254 316 1 1
Oreg. 12 31 380 600 5 2 71 91 1 1
Calif. 477 962 4,469 8,078 12 4 1,190 2,167 26 54
Alaska - 16 167 190 - - 29 72 - -
Hawaii 5 5 235 167 N 1 43 56 24 27
Guam - - 8 36 N - 2 4 - -
P.R. 88 144 U U 1 U 53 75 2 7
V.I. 1 4 N N N U - - - -
Amer. Samoa - - - - N U - - - -
C.N.M.I. - - N N N U 7 4 - 2
------------------------------------------------------------------------------------------------------------------------------
N: Not notifiable U: Unavailable -: no reported cases C.N.M.I.: Commonwealth of North Mariana Islands
* Updated monthly to the Division of HIV/AIDS Prevention, -- Surveillance and Epidemiology, National Center for HIV, STD,
and TB Prevention, last update January 25, 1998.
** National Electronic Telecommunications System for Surveillance.
*** Public Health Laboratory Information System.
=======================================================================================================================================================
TABLE II. (page 2) Provisional cases of selected notifiable diseases, United States, weeks ending
February 21, 1998, and February 15, 1997 (7th Week)
Lyme Syphilis Rabies,
Legionellosis Disease Malaria (Primary & Secondary) Tuberculosis Animal
---------------- ---------------- ---------------- --------------------- ----------------- -------
Cum. Cum. Cum. Cum. Cum. Cum. Cum. Cum. Cum. Cum. Cum.
Reporting Area 1998 1997 1998 1997 1998 1997 1998 1997 1998 * 1997 1998
-------------------------------------------------------------------------------------------------------------------------------------------
UNITED STATES 105 120 241 390 99 171 805 1,176 566 1,402 765
NEW ENGLAND 6 8 24 85 4 6 11 17 21 26 136
Maine - - - - - - - - U 2 18
N.H. 1 2 - 3 - 1 - - - - 12
Vt. - 2 - 2 - - - - - - 3
Mass. 2 3 13 14 4 4 11 9 17 7 41
R.I. 3 - 2 9 - 1 - - 4 4 13
Conn. - 1 9 57 - - - 8 U 13 49
MID. ATLANTIC 16 19 124 257 20 30 37 49 37 154 208
Upstate N.Y. 9 4 32 22 9 3 1 8 U 15 124
N.Y. City - - - 17 8 13 5 10 U 85 U
N.J. - 2 - 76 - 12 10 23 37 34 32
Pa. 7 13 92 142 3 2 21 8 U 20 52
E.N. CENTRAL 33 51 14 1 7 19 117 109 38 164 3
Ohio 18 28 14 - 1 1 33 37 5 44 3
Ind. 3 5 - - 1 2 34 24 U 14 -
Ill. - 1 - 1 - 8 31 14 33 103 -
Mich. 11 16 - - 5 7 15 14 U - -
Wis. 1 1 U U - 1 4 20 U 3 -
W.N. CENTRAL 9 8 1 1 2 3 11 27 17 37 60
Minn. - - - - - - - 7 U 16 9
Iowa - - 1 - 1 1 - 1 U 4 20
Mo. 7 4 - - 1 2 8 14 17 9 1
N. Dak. - - - - - - - - U 1 17
S. Dak. - - - - - - - - - 1 6
Nebr. 2 3 - 1 - - - - - - -
Kans. - 1 - - - - 3 5 U 6 7
S. ATLANTIC 22 14 59 30 32 38 334 463 95 158 297
Del. 1 1 - 2 1 1 - 3 - 6 -
Md. 5 7 53 23 16 13 62 137 23 17 72
D.C. 2 1 3 3 3 3 9 15 13 6 -
Va. 2 - - - 2 8 36 33 5 16 77
W. Va. N N - - - - - - 9 6 7
N.C. 3 3 - 1 4 1 93 96 45 26 75
S.C. 1 - - - - 3 45 57 U 9 9
Ga. - - 2 1 4 7 61 87 U 31 26
Fla. 8 2 1 - 2 2 28 35 U 41 31
E.S. CENTRAL 1 5 6 11 4 5 162 266 - 109 18
Ky. - - - 1 - 1 15 15 U 20 2
Tenn. 1 1 5 2 3 1 87 109 U 39 8
Ala. - 1 1 - 1 1 36 70 U 36 8
Miss. - 3 - 8 - 2 24 72 U 14 -
W.S. CENTRAL - 1 - - 2 - 83 174 5 210 22
Ark. - - - - - - 23 25 5 11 1
La. - - - - 2 - 52 71 - 6 -
Okla. - 1 - - - - 8 21 U 20 21
Tex. - - - - - - - 57 U 173 -
MOUNTAIN 7 9 1 - 8 11 30 26 28 28 8
Mont. - - - - - 1 - - - - 3
Idaho - - - - 1 - - - - - -
Wyo. - - - - - 1 - - 1 1 5
Colo. 2 3 - - 3 6 2 - U 10 -
N. Mex. 1 - - - 3 - - - 7 - -
Ariz. - 3 - - - - 26 23 14 13 -
Utah 4 2 - - 1 - 2 - 6 1 -
Nev. - 1 1 - - 3 - 3 U 3 -
PACIFIC 11 5 12 5 20 59 20 45 325 516 13
Wash. - 1 - - - - 3 - U 32 -
Oreg. - - - 2 5 2 1 1 U 16 -
Calif. 11 3 12 3 15 57 16 44 312 427 11
Alaska - - - - - - - - 3 12 2
Hawaii - 1 - - - - - - 10 29 -
Guam - - - - - - - - - 7 -
P.R. - - - - - 2 45 30 - - 7
V.I. - - - - - - - - - - -
Amer. Samoa - - - - - - - - - - -
C.N.M.I. - - - - - - 1 - 8 - -
-------------------------------------------------------------------------------------------------------------------------------------------
N: Not notifiable U: Unavailable -: no reported cases
* Additional information about areas displaying 'U' (e.g., Tuberculosis) can be found in Notices to Readers, MMWR Vol. 47, No. 2, p. 39.
=======================================================================================================================================================
Return to top. Table_III Note: To print large tables and graphs users may have to change their printer settings to landscape and use a small font size.
TABLE III. (page 1) Provisional cases of selected notifiable diseases preventable by vaccination, United
States, weeks ending February 21, 1998, and February 15, 1997 (7th Week)
Hepatitis (Viral), by type Measles (Rubeola)
H. influenzae, --------------------------------------- ------------------------------------------------------------
invasive A B Indigenous Imported** Total
---------------- ----------------- ----------------- --------------- --------------- ---------------
Cum. Cum. Cum. Cum. Cum. Cum. Cum. Cum. Cum. Cum.
Reporting Area 1998* 1997 1998 1997 1998 1997 1998 1998 1998 1998 1998 1997
-----------------------------------------------------------------------------------------------------------------------------------------------------
UNITED STATES 119 149 1,839 3,231 710 934 - - - 2 2 11
NEW ENGLAND 8 12 42 73 4 25 - - - 1 1 -
Maine - 2 8 2 - 1 - - - - - -
N.H. 1 2 1 4 2 2 - - - - - -
Vt. - - 2 3 - 1 - - - - - -
Mass. 7 7 7 35 - 16 - - - 1 1 -
R.I. - 1 4 2 2 1 - - - - - -
Conn. - - 20 27 - 4 - - - - - -
MID. ATLANTIC 13 20 84 300 92 163 - - - 1 1 4
Upstate N.Y. 5 1 41 12 30 16 - - - 1 1 2
N.Y. City 1 8 23 156 24 72 - - - - - 1
N.J. 7 8 2 54 - 33 - - - - - 1
Pa. - 3 18 78 38 42 - - - - - -
E.N. CENTRAL 15 25 297 372 94 171 - - - - - 1
Ohio 12 15 58 76 11 13 - - - - - -
Ind. 2 2 39 35 5 18 - - - - - -
Ill. - 5 11 131 3 52 - - - - - -
Mich. - 3 178 97 74 78 - - - - - 1
Wis. 1 - 11 33 1 10 - - - - - -
W.N. CENTRAL 1 5 207 226 51 70 - - - - - -
Minn. - 2 5 1 2 - U - U - - -
Iowa - 1 81 31 5 3 - - - - - -
Mo. 1 2 106 141 40 57 - - - - - -
N. Dak. - - - - - - - - - - - -
S. Dak. - - 1 5 1 - - - - - - -
Nebr. - - 3 9 1 3 - - - - - -
Kans. - - 11 39 2 7 - - - - - -
S. ATLANTIC 33 26 176 203 101 78 - - - - - -
Del. - - - 6 - 1 - - - - - -
Md. 8 9 49 65 15 24 - - - - - -
D.C. - - 6 4 1 6 - - - - - -
Va. 3 2 20 21 7 10 - - - - - -
W. Va. 1 1 - 1 - 2 U - U - - -
N.C. 3 6 13 30 41 16 - - - - - -
S.C. - 2 6 11 - 7 - - - - - -
Ga. 7 3 27 28 12 - - - - - - -
Fla. 11 3 55 37 25 12 - - - - - -
E.S. CENTRAL 6 12 57 96 61 75 - - - - - 1
Ky. - 1 - 17 - 2 - - - - - -
Tenn. 6 6 43 42 48 55 - - - - - -
Ala. - 5 14 19 13 5 - - - - - 1
Miss. - - - 18 - 13 - - - - - -
W.S. CENTRAL 7 5 68 326 16 28 - - - - - -
Ark. - - 4 30 10 6 - - - - - -
La. 3 - 3 6 3 3 - - - - - -
Okla. 3 4 54 191 3 - - - - - - -
Tex. 1 1 7 99 - 19 - - - - - -
MOUNTAIN 26 9 403 556 108 112 - - - - - -
Mont. - - 6 18 1 - - - - - - -
Idaho - - 25 29 4 1 - - - - - -
Wyo. - - 4 3 2 3 - - - - - -
Colo. 1 1 44 77 12 32 - - - - - -
N. Mex. - 1 29 35 39 34 - - - - - -
Ariz. 17 2 244 219 30 24 - - - - - -
Utah 2 1 26 133 8 11 - - - - - -
Nev. 6 4 25 42 12 7 - - - - - -
PACIFIC 10 35 505 1,079 183 212 - - - - - 5
Wash. - - 46 48 14 4 - - - - - -
Oreg. 9 6 48 66 14 15 - - - - - -
Calif. - 27 407 936 152 186 - - - - - 2
Alaska - - - 5 1 4 - - - - - -
Hawaii 1 2 4 24 2 3 - - - - - 3
Guam - - - - - 1 U - U - - -
P.R. - - - 25 35 66 - - - - - -
V.I. - - - - - - U - U - - -
Amer. Samoa - - - - - - U - U - - -
C.N.M.I. - 2 - 1 7 5 U - U - - -
-----------------------------------------------------------------------------------------------------------------------------------------------------
N: Not notifiable U: Unavailable -: no reported cases
* Of 23 cases among children aged <5 years, serotype was reported for 11 and of those, 6 were type b.
** For imported measles, cases include only those resulting from importation from other countries.
=======================================================================================================================================================
TABLE III. (page 2) Provisional cases of selected notifiable diseases preventable by vaccination, United
States, weeks ending February 21, 1998, and February 15, 1997 (7th Week)
Meningococcal
Disease Mumps Pertussis Rubella
----------------- -------------------------- --------------------------- ---------------------------
Cum. Cum. Cum. Cum. Cum. Cum. Cum. Cum.
Reporting Area 1998 1997 1998 1998 1997 1998 1998 1997 1998 1998 1997
------------------------------------------------------------------------------------------------------------------------------------------
UNITED STATES 379 547 10 40 52 35 405 608 3 17 6
NEW ENGLAND 30 34 - - 2 4 82 212 - - -
Maine 3 3 - - - - 4 4 - - -
N.H. 1 3 - - - 1 6 26 - - -
Vt. 1 - - - - 1 15 75 - - -
Mass. 12 23 - - - 2 57 100 - - -
R.I. 3 1 - - 1 - - 7 - - -
Conn. 10 4 - - 1 - - - - - -
MID. ATLANTIC 31 48 - 1 7 1 27 35 2 12 2
Upstate N.Y. 12 6 - 1 - 1 27 17 2 12 -
N.Y. City 4 9 - - 1 - - 8 - - 2
N.J. 15 8 - - 2 - - 3 - - -
Pa. - 25 - - 4 - - 7 - - -
E.N. CENTRAL 51 79 1 5 8 6 42 71 - - 3
Ohio 31 31 - 3 3 5 28 34 - - -
Ind. 8 9 - - 2 - 2 - - - -
Ill. - 25 - - 1 - - 8 - - -
Mich. 8 5 1 2 2 1 8 17 - - -
Wis. 4 9 - - - - 4 12 - - 3
W.N. CENTRAL 33 47 - - 2 1 25 22 - - -
Minn. - 2 U - - U 18 10 U - -
Iowa 6 10 - - 2 1 5 5 - - -
Mo. 15 24 - - - - - - - - -
N. Dak. - - - - - - - 1 - - -
S. Dak. 4 3 - - - - - 1 - - -
Nebr. 1 3 - - - - 2 2 - - -
Kans. 7 5 - - - - - 3 - - -
S. ATLANTIC 76 100 3 12 2 9 44 39 - 1 -
Del. - 2 - - - - - - - - -
Md. 11 10 - 2 - 1 7 30 - - -
D.C. - 2 - - - - - 2 - - -
Va. 8 6 1 1 1 - - 2 - - -
W. Va. 2 3 U - - U - 1 U - -
N.C. 14 20 - 4 - - 23 - - 1 -
S.C. 5 22 - 2 - 5 5 3 - - -
Ga. 21 18 - - - - - - - - -
Fla. 15 17 2 3 1 3 9 1 - - -
E.S. CENTRAL 16 52 - - 6 - 11 17 - - -
Ky. - 11 - - - - - 4 - - -
Tenn. 16 18 - - 2 - 3 3 - - -
Ala. - 18 - - 2 - 8 6 - - -
Miss. - 5 - - 2 - - 4 - - -
W.S. CENTRAL 23 20 2 8 3 2 14 8 - 1 -
Ark. 3 7 - - - 1 7 2 - - -
La. 7 2 - - - - - - - - -
Okla. 13 4 - - - - - - - - -
Tex. - 7 2 8 3 1 7 6 - 1 -
MOUNTAIN 27 33 2 4 4 8 141 125 1 3 -
Mont. 1 1 - - - - 1 - - - -
Idaho - 3 - - - 4 82 78 - - -
Wyo. 1 - 1 1 - - - 3 - - -
Colo. 11 2 - - 1 - 12 32 - - -
N. Mex. 4 8 N N N 1 37 7 - - -
Ariz. 8 11 - 1 - 3 3 4 - - -
Utah 1 3 - - 1 - 4 - - 2 -
Nev. 1 5 1 2 2 - 2 1 1 1 -
PACIFIC 92 134 2 10 18 4 19 79 - - 1
Wash. 12 10 - - 2 4 11 13 - - -
Oreg. 28 36 N N N - 8 4 - - -
Calif. 51 87 2 4 12 - - 59 - - 1
Alaska 1 - - 2 - - - 1 - - -
Hawaii - 1 - 4 4 - - 2 - - -
Guam - - U - 1 U - - U - -
P.R. - 2 - - 2 - - - - - -
V.I. - - U - - U - - U - -
Amer. Samoa - - U - - U - - U - -
C.N.M.I. - - U - - U - - U - -
------------------------------------------------------------------------------------------------------------------------------------------
N: Not notifiable U: Unavailable -: no reported cases
=======================================================================================================================================================
Return to top. Table_IV Note: To print large tables and graphs users may have to change their printer settings to landscape and use a small font size.
TABLE IV. Deaths in 122 U.S. cities,* week ending
February 21, 1998 (7th Week)
===================================================================================================================================
All Causes, By Age (Years)
------------------------------------------------------------------------ P&I**
Reporting Area All Ages >=65 45-64 25-44 1-24 <1 Total
---------------------------------------------------------------------------------------------------------------
NEW ENGLAND 722 549 125 26 10 12 76
Boston, Mass. 180 128 39 8 4 1 25
Bridgeport, Conn. 35 26 7 - 1 1 1
Cambridge, Mass. 21 18 3 - - - 5
Fall River, Mass. 40 33 7 - - - 2
Hartford, Conn. 64 48 9 4 - 3 5
Lowell, Mass. 37 29 8 - - - 3
Lynn, Mass. 15 13 2 - - - 2
New Bedford, Mass. 33 25 6 1 - 1 2
New Haven, Conn. 40 23 8 5 3 1 5
Providence, R.I. 83 71 8 2 - 2 -
Somerville, Mass. 3 3 - - - - -
Springfield, Mass. 44 32 8 2 1 1 2
Waterbury, Conn. 39 31 7 1 - - 4
Worcester, Mass. 88 69 13 3 1 2 20
MID. ATLANTIC 2,453 1,739 465 169 45 35 166
Albany, N.Y. 57 48 4 3 2 - 3
Allentown, Pa. 34 27 6 1 - - -
Buffalo, N.Y. U U U U U U U
Camden, N.J. 33 23 8 1 - 1 6
Elizabeth, N.J. 37 30 5 2 - - -
Erie, Pa. 63 52 8 3 - - 5
Jersey City, N.J. 52 28 13 7 4 - 2
New York City, N.Y. 1,263 869 263 91 21 19 59
Newark, N.J. 75 41 20 12 2 - 7
Paterson, N.J. 46 36 4 3 2 1 -
Philadelphia, Pa. 298 188 75 22 4 9 28
Pittsburgh, Pa.*** 74 59 11 2 1 1 5
Reading, Pa. 47 40 5 2 - - 3
Rochester, N.Y. 160 122 24 7 6 1 22
Schenectady, N.Y. 31 25 2 3 1 - 3
Scranton, Pa. 31 26 3 2 - - 3
Syracuse, N.Y. 102 87 6 4 2 3 17
Trenton, N.J. 21 12 5 4 - - 1
Utica, N.Y. 29 26 3 - - - 2
Yonkers, N.Y. U U U U U U U
E.N. CENTRAL 2,327 1,632 424 172 40 59 194
Akron, Ohio 68 53 8 6 - 1 1
Canton, Ohio 39 30 7 1 1 - 1
Chicago, Ill. 450 287 99 45 7 12 36
Cincinnati, Ohio 123 85 18 10 4 6 14
Cleveland, Ohio 138 85 34 11 5 3 6
Columbus, Ohio 202 131 48 14 2 7 22
Dayton, Ohio 120 98 17 4 - 1 11
Detroit, Mich. 259 172 56 23 6 2 14
Evansville, Ind. 46 39 3 4 - - 2
Fort Wayne, Ind. 57 45 8 4 - - 2
Gary, Ind. 19 9 5 2 1 2 -
Grand Rapids, Mich. 79 57 11 5 2 4 13
Indianapolis, Ind. 217 158 35 13 6 5 21
Lansing, Mich. 57 41 8 5 - 3 3
Milwaukee, Wis. 136 101 22 10 2 1 13
Peoria, Ill. 52 27 10 10 1 4 9
Rockford, Ill. 59 42 10 1 2 4 5
South Bend, Ind. 59 52 4 2 1 - 8
Toledo, Ohio 84 69 12 2 - 1 8
Youngstown, Ohio 63 51 9 - - 3 5
W.N. CENTRAL 782 595 121 29 13 17 71
Des Moines, Iowa U U U U U U U
Duluth, Minn. 43 40 2 1 - - 5
Kansas City, Kans. 25 17 5 1 1 1 1
Kansas City, Mo. 106 67 24 4 4 - 6
Lincoln, Nebr. 43 33 8 2 - - 6
Minneapolis, Minn. 189 146 32 5 2 4 27
Omaha, Nebr. 91 66 17 3 1 4 9
St. Louis, Mo. 131 103 12 7 3 6 -
St. Paul, Minn. 89 72 11 3 1 2 13
Wichita, Kans. 65 51 10 3 1 - 4
S. ATLANTIC 1,146 778 234 76 31 26 82
Atlanta, Ga. U U U U U U U
Baltimore, Md. 144 83 36 13 4 8 10
Charlotte, N.C. 115 79 23 8 2 3 19
Jacksonville, Fla. 179 125 32 11 8 3 5
Miami, Fla. 111 71 24 10 4 2 1
Norfolk, Va. 60 37 16 4 - 3 8
Richmond, Va. 94 66 14 9 4 1 9
Savannah, Ga. U U U U U U U
St. Petersburg, Fla. 114 89 20 3 2 - 8
Tampa, Fla. 208 147 42 8 4 6 14
Washington, D.C. 101 66 25 7 3 - 8
Wilmington, Del. 20 15 2 3 - - -
E.S. CENTRAL 925 648 186 54 15 22 90
Birmingham, Ala. 228 159 49 11 2 7 30
Chattanooga, Tenn. 52 35 14 1 1 1 6
Knoxville, Tenn. 114 93 18 2 1 - 17
Lexington, Ky. 68 50 15 2 - 1 11
Memphis, Tenn. 166 118 26 10 6 6 15
Mobile, Ala. 79 61 11 3 2 2 -
Montgomery, Ala. 61 39 14 6 - 2 8
Nashville, Tenn. 157 93 39 19 3 3 3
W.S. CENTRAL 1,475 983 288 103 69 32 102
Austin, Tex. 77 50 17 4 5 1 4
Baton Rouge, La. 62 41 12 7 1 1 1
Corpus Christi, Tex. 62 51 8 3 - - 4
Dallas, Tex. 198 120 46 13 12 7 11
El Paso, Tex. 47 35 3 7 1 1 7
Ft. Worth, Tex. 127 94 18 10 4 1 9
Houston, Tex. 317 193 80 20 19 5 22
Little Rock, Ark. 68 48 14 4 - 2 5
New Orleans, La. 102 50 15 12 19 6 -
San Antonio, Tex. 196 144 35 11 3 3 14
Shreveport, La. 80 60 12 3 3 2 8
Tulsa, Okla. 139 97 28 9 2 3 17
MOUNTAIN 1,095 781 189 75 29 20 115
Albuquerque, N.M. 126 89 17 10 7 3 11
Boise, Idaho 37 27 7 - - 3 -
Colo. Springs, Colo. 69 51 13 3 1 1 7
Denver, Colo. 132 86 31 11 1 3 20
Las Vegas, Nev. 308 220 61 17 7 3 25
Ogden, Utah 16 12 3 1 - - 3
Phoenix, Ariz. 114 67 25 9 9 3 11
Pueblo, Colo. 38 33 3 2 - - 7
Salt Lake City, Utah 97 70 14 9 1 3 11
Tucson, Ariz. 158 126 15 13 3 1 20
PACIFIC 1,331 1,020 197 77 21 16 165
Berkeley, Calif. 12 8 2 2 - - 2
Fresno, Calif. U U U U U U U
Glendale, Calif. U U U U U U U
Honolulu, Hawaii 86 70 9 5 1 1 10
Long Beach, Calif. 57 45 7 4 - 1 12
Los Angeles, Calif. U U U U U U U
Pasadena, Calif. 22 16 4 1 - 1 1
Portland, Oreg. 121 92 17 6 6 - 9
Sacramento, Calif. 200 159 29 7 2 3 40
San Diego, Calif. 137 105 20 7 4 1 15
San Francisco, Calif. 130 95 21 11 3 - 20
San Jose, Calif. 232 181 34 13 2 2 30
Santa Cruz, Calif. 30 23 4 2 1 - 4
Seattle, Wash. 129 85 32 8 2 2 6
Spokane, Wash. 73 56 8 6 - 3 9
Tacoma, Wash. 102 85 10 5 - 2 7
TOTAL 12,256**** 8,725 2,229 781 273 239 1,061
---------------------------------------------------------------------------------------------------------------
U: Unavailable -: no reported cases
* Mortality data in this table are voluntarily reported from 122 cities in the United States, most of which have populations
of 100,000 or more. A death is reported by the place of its occurrence and by the week that the death certificate was
filed. Fetal deaths are not included.
** Pneumonia and influenza.
*** Because of changes in reporting methods in this Pennsylvania city, these numbers are partial counts for the current
week. Complete counts will be available in 4 to 6 weeks.
**** Total includes unknown ages.
===================================================================================================================================
Return to top. Disclaimer All MMWR HTML versions of articles are electronic conversions from ASCII text into HTML. This conversion may have resulted in character translation or format errors in the HTML version. Users should not rely on this HTML document, but are referred to the electronic PDF version and/or the original MMWR paper copy for the official text, figures, and tables. An original paper copy of this issue can be obtained from the Superintendent of Documents, U.S. Government Printing Office (GPO), Washington, DC 20402-9371; telephone: (202) 512-1800. Contact GPO for current prices. **Questions or messages regarding errors in formatting should be addressed to [email protected].Page converted: 10/05/98 |
|||||||||
This page last reviewed 5/2/01
|