 |
|
|
|
|
|
|
| ||||||||||
|
|
|
|
|
|
|
||||
| ||||||||||
|
|
|
|
|
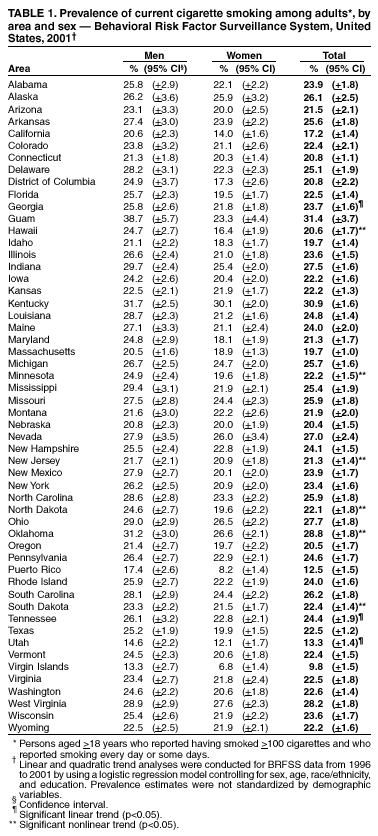
Persons using assistive technology might not be able to fully access information in this file. For assistance, please send e-mail to: [email protected]. Type 508 Accommodation and the title of the report in the subject line of e-mail. Prevalence of Current Cigarette Smoking Among Adults and Changes in Prevalence of Current and Some Day Smoking --- United States, 1996--2001Tobacco use, particularly cigarette smoking, is the leading preventable cause of death in the United States and is responsible for approximately 440,000 deaths each year (1). One of the national health objectives for 2010 is to reduce the prevalence of cigarette smoking among adults to <12% (objective 27.1) (2). To examine the prevalence of smoking for the 50 states, the District of Columbia (DC), Guam, Puerto Rico, and the Virgin Islands, CDC analyzed data from the 2001 Behavioral Risk Factor Surveillance System (BRFSS). This report summarizes the results of that analysis, which indicate that, during 2001, the median adult current smoking prevalence was 23.4% (range: 13.3%--30.9%) for the states and DC, and 12.5% (range: 9.8%--31.4%) for Guam, Puerto Rico, and the Virgin Islands. During 1996--2001, the prevalence of current smoking was relatively stable in 41 states and DC, and the proportion of current smokers who were some day smokers increased significantly in 31 of those states and DC. Because the only safe alternative to smoking is cessation, interventions should target all smokers to help them quit smoking completely. BRFSS is a state-based, random-digit--dialed telephone survey of the non-institutionalized U.S. adult population aged >18 years. The 2001 BRFSS was conducted in the 50 states, DC, Guam, Puerto Rico, and the Virgin Islands. To determine current cigarette smoking, respondents were asked, "Have you smoked at least 100 cigarettes in your entire life?" and "Do you now smoke cigarettes every day, some days, or not at all?" "Current smokers" were defined as those who reported having smoked >100 cigarettes during their lifetime and who currently smoked every day or some days. "Some day" smokers were current smokers who responded that they smoked some days. Data on current smoking have been available since 1996. Estimates were weighted by the sex, age, and race/ethnicity distributions of each area's population, and 95% confidence intervals (CIs) were calculated by using SUDAAN. The median response rate was 63.2% (range: 45.6%--87.1%) in 1996 and 53.5% (range: 48.9%--63.2%) in 2001. Temporal changes in current smoking and the proportion of some day smokers among current smokers were analyzed for 1996--2001, controlling for sex, age, race/ethnicity, and education by using logistic regression analysis. Both linear and quadratic terms were included in the models. Quadratic trends indicated a significant but nonlinear trend in the data over time (i.e., leveling off or changing direction). In 2001, the median prevalence of current smoking in the 50 states and DC was 23.4% (range: 13.3%--30.9%) (Table 1). Prevalence was highest in Kentucky (30.9%), Oklahoma (28.8%), West Virginia (28.2%), Ohio (27.7%), Indiana (27.5%), Nevada (27.0%), South Carolina (26.2%), and Alaska (26.1%), and lowest in Utah (13.3%), California (17.2%), Massachusetts (19.7%), Idaho (19.7%), Nebraska (20.4%), Oregon (20.5%), Hawaii (20.6%), Connecticut (20.8%), and DC (20.8%). Current smoking prevalence was 9.8% in the Virgin Islands, 12.5% in Puerto Rico, and 31.4% in Guam. Smoking prevalence by sex varied significantly in 15 states and Guam, Puerto Rico, and the Virgin Islands, with rates being higher for men than for women. In the 50 states and DC, the median prevalence of cigarette smoking among men was 25.5% (range: 14.6%--31.7%) and among women was 21.5% (range: 12.1%--30.1%). Among both men and women, the prevalence was highest in Kentucky and lowest in Utah. In Guam, Puerto Rico, and the Virgin Islands, among both men and women, the prevalence was highest in Guam and lowest in the Virgin Islands. During 1996--2001, no change in the prevalence of current smoking was noted for 41 states and DC. Significant linear or quadratic trends were detected in current smoking for 1996--2001 in nine states. Among the nine states for which changes in current smoking prevalence were found, Georgia, Tennessee, and Utah had linear decreases; Hawaii had a nonlinear decrease; and Oklahoma had a non-linear increase. In addition, smoking prevalence declined and then increased in Minnesota and New Jersey, and increased and then declined steadily in South Dakota. The pattern in North Dakota was more complex: observed rates decreased during 1996--1998 followed by an increase through 2000 and a decline in 2001. During 2001, among the 50 states and DC, the median proportion of some day smokers among current smokers was 24.0% (range: 15.2% [Kentucky]-- 41.2% [DC]) (Table 2). During 1996--2001, significant linear increases in the proportion of some day smokers among current smokers were noted in 31 states and DC, and seven states had nonlinear increases (Arizona, Kansas, Maryland, Missouri, Nevada, Rhode Island, and South Carolina) (Table 2). For DC and 31 of the 38 states with significant time trends in the proportion of some day smokers among current smokers, no change in the prevalence of current smoking occurred during 1996--2001. Analysis of the combined data for 1996--2001 for all 50 states and DC indicated that the median proportion of some day smokers among current smokers was slightly higher among men than women (22.2% [range: 21.8%--22.7%] and 21.1% [range: 20.7%--21.5%], respectively) and decreased with age except for those aged >65 years (28.7% [range: 27.8%--29.7%], 22.1% [range: 21.7%--22.5%], 17.6% [range: 17.1%--18.1%], and 20.3% [range: 19.3%--21.2%], respectively, for those aged 18--24 years, 25--44 years, 45--64 years, and >65 years). Prevalence of some day smokers also was higher among Hispanics and non-Hispanic blacks than non-Hispanic whites (38.1% [range: 36.5%--39.8%], 26.9% [range: 25.9%--27.9%], and 18.7% [range: 18.4%--19.0%], respectively) and was highest among smokers with <8 years of education, at least some college education, and at least a college education compared with respondents with some high school education or high school graduates (24.2% [range: 22.4%--26.1%], 23.2% [range: 22.7%--23.8%], 31.7% [range: 30.9%--32.5%], 17.2% [range: 16.4%--18.0%], and 17.9% [range: 17.5--18.4%], respectively). The patterns for sex, age, and race/ethnicity were generally the same across each state and DC, regardless of whether the overall proportion of some day smokers among current smokers had increased. However, among areas with significant increases in some day smoking, only respondents with at least some college education or a college degree had an increased rate of some day smoking during 1996--2001. Reported by: S Porter, MPA, K Jackson, MSPH, A Trosclair, MS, LL Pederson, PhD, Office on Smoking and Health, National Center for Chronic Disease Prevention and Health Promotion, CDC. Editorial Note:The median prevalence of current smoking did not change substantially during 2000--2001 (3). However, smoking prevalence varied among the states, DC, Guam, Puerto Rico, and the Virgin Islands. As in 2000, during 2001, Kentucky and Nevada remained among the states with the highest prevalence, and Utah, California, and Puerto Rico remained among all areas with the lowest prevalence. During 2001, the national health objective for 2010 of <12% of adults smoking cigarettes was achieved only in the Virgin Islands (9.8%). The low prevalence of smoking in the Virgin Islands, Puerto Rico, and Utah might be the result of stronger social and cultural norms against tobacco use compared with other parts of the country. The findings in this report are subject to at least six limitations. First, BRFSS does not sample persons living in institutions or persons living in households without a telephone, both of which are subgroups at higher risk for smoking. Second, data were based on self-reports, which might be subject to recall bias, and no biochemical verification was used to assess smoking status. However self-report generally has been found to be accurate in population-based surveys among adults. Third, the validity of self-report of every day versus some day smoking has not been assessed. Fourth, prevalence estimates and trend data could have been affected by low response rates. However, demographic characteristics of BRFSS responders are consistent with U.S. census data, and BRFSS estimates are comparable to estimates of current smoking obtained through analysis of other surveys with higher response rates (e.g., National Health Interview Survey [NHIS] data or data collected through the Tobacco Use Supplement of the Current Population Survey) (4). Fifth, the trend analysis was conducted by using data collected during 1996--2001; more recent data should be evaluated to verify trends found in this analysis. Finally, for some states (e.g., North Dakota), higher order models might be more appropriate. The findings in this report document that even though current state-specific smoking rates have not declined significantly since 1996, the pattern of smoking has changed. Factors that might have contributed to the shift include increased retail price of cigarettes and smoking bans in public places (5,6). Massachusetts and California have reported other changes in smoking patterns. An independent evaluation of the Massachusetts Tobacco Control Program (7) reported a decline in smoking prevalence from 22.6% (95% CI = 21.3%--23.9% ) in 1993 to 20.9% (95% CI = 18.4%--23.4% ) in 1999, with a small but significant decline in the proportion of persons reporting smoking daily (81% in 1993 compared with 79% in 1999). Data collected through the California Tobacco Survey indicated that, along with overall decreases in prevalence of current smoking, the proportion of current smokers who were some day smokers increased significantly from 25.9% (95% CI = 22.6%--29.2%) in 1992 to 32.1% in 1996 (95% CI = 30.0%--34.2%) and from 32.1% in 1996 (95% CI = 30%--34.2%) to 36.4% in 1999 (95% CI = 34.3%--38.5%) (8). The data in this report are consistent with characteristics of some day smokers observed in the 1997 and 1998 NHIS (9), except for the higher prevalence of some day smoking among men and the higher prevalence of some day smoking reported by respondents aged >65 years in BRFSS. Although some smokers appear to be reducing their cigarette consumption, results from a recent large cohort study indicate that reduction of daily tobacco consumption by >50% without quitting did not decrease mortality rates from tobacco-related diseases compared with smokers who continued to smoke heavily (>15 cigarettes per day) (10). States are encouraged to implement comprehensive tobacco control programs such as those implemented in California and Massachusetts during the 1990s, which encourage smokers to stop smoking completely (7,8). Acknowledgment This report is based on data contributed by state BRFSS coordinators. References
Table 1
Disclaimer All MMWR HTML versions of articles are electronic conversions from ASCII text into HTML. This conversion may have resulted in character translation or format errors in the HTML version. Users should not rely on this HTML document, but are referred to the electronic PDF version and/or the original MMWR paper copy for the official text, figures, and tables. An original paper copy of this issue can be obtained from the Superintendent of Documents, U.S. Government Printing Office (GPO), Washington, DC 20402-9371; telephone: (202) 512-1800. Contact GPO for current prices. **Questions or messages regarding errors in formatting should be addressed to [email protected].Page converted: 4/10/2003 |
|||||||||
This page last reviewed 4/10/2003
|