 |
|
|
|
|
|
|
| ||||||||||
|
|
|
|
|
|
|
||||
| ||||||||||
|
|
|
|
|
Persons using assistive technology might not be able to fully access information in this file. For assistance, please send e-mail to: [email protected]. Type 508 Accommodation and the title of the report in the subject line of e-mail. Visual Impairment and Use of Eye-Care Services and Protective Eyewear Among Children --- United States, 2002Visual impairment is an important cause of developmental disability among children (1). Ocular conditions, if undetected or untreated, can have substantial long-term implications for the quality of life of the child and the family and can place a burden on public health resources (2). For these reasons, the national health objectives for 2010 now include three vision objectives for children: 1) reducing visual impairment and blindness, 2) increasing the proportion of preschool children who receive vision screening, and 3) increasing the use of protective eyewear in recreational activities and hazardous situations around the home (objective nos. 28-2, 28-4, and 28-9a) (3). When these objectives were published in November 2000, baseline data were available for only one objective, that of reducing visual impairment and blindness among children. To address all three childhood vision objectives, CDC analyzed data from the 2002 National Health Interview Survey (NHIS). This report summarizes the results of that analysis, which indicated that the prevalence of visual impairment and the use of eye-care services were significantly* higher among children aged >6 years, compared with younger children, and varied by race/ethnicity and family income. As a result of that analysis, national baselines are now available for all three objectives. Collaborative efforts of all relevant agencies, health professionals, educators, and the public are needed to achieve the national childhood vision objectives for 2010. NHIS is a stratified, multistage probability sample survey of the U.S. civilian, noninstitutionalized population (4). In 2002, the response rate for the child sample (i.e., persons aged <18 years) was 81.3%. Information was collected regarding 12,524 children from a parent or other knowledgeable adult in the family. Children were classified as having visual impairment if the respondents answered "yes" to the question: "Does [name of child] have any trouble seeing, even when wearing glasses or contact lenses?"† This question also included blind children. Use of eye-care services during the preceding year was based on response to the question, "During the past 12 months, has anyone in the family seen or talked to an optometrist, ophthalmologist, or eye doctor (someone who prescribes glasses) about [name of child's] health?" This question included all children in this sample. Information on vision testing was determined for children aged <6 years by asking, "Has [name of child] ever had [his/her] vision tested by a doctor or other health professional?" Information on participation in sports, hobbies, or other activities that can cause eye injury was obtained for children aged 6--17 years: "Does [name of child] participate in sports, hobbies, or other activities that can cause eye injury? This includes activities such as baseball, basketball, soccer, and mowing the lawn." Parents of children who participated in these activities received an additional question on use of protective eyewear: "When doing these activities, on average, does [name of child] wear eye protection always, most of the time, some of the time, or none of the time?" (4). The prevalences of visual impairment and use of eye-care services and protective eyewear for children were determined by sex, age, race/ethnicity, and family income. All data were weighted to reflect the demographic distribution of the U.S. civilian, noninstitutionalized population aged <18 years, and analyses were conducted by using statistical software. Statistical tests performed to assess significance of differences in the estimates were two-tailed, with the critical value 1.96 at the 0.05 level of significance. Multiple imputation was used to account for the 32% of family income data that were unavailable (5). In 2002, the prevalence of reported visual impairment and blindness among children aged <18 years was 2.5% (Table 1). The prevalence was significantly lower for children aged <6 years (1.0%) than for children aged 6--17 years (3.3%). Hispanic children had a significantly higher prevalence of reported visual impairment and blindness (3.6%) than non-Hispanic white children (2.3%). Children whose families were below the federal poverty level were nearly twice as likely to be visually impaired as children from families whose income was >200% of the poverty level. Among children aged <6 years, 36.3% were reported to have ever had their vision tested, and 7.4% had visited an eye-care provider during the preceding year (Table 2). Among all children aged <18 years, 20.7% had visited an eye-care provider during the preceding year. Asian, non-Hispanic black, and Hispanic children (15.0%, 19.1%, and 15.5%, respectively) were significantly less likely to have visited an eye-care provider during the preceding 12 months than non-Hispanic white children (22.8%). The proportion of teenagers with a reported visit to an eye-care provider during the preceding year was significantly higher than the proportion in the youngest age group: 30.6% of adolescents aged 15--17 years and 30.1% of those aged 12--14 years, compared with 7.4% in children aged <6 years. Children from families with incomes >200% of the federal poverty level were more likely to see an eye-care provider during the preceding 12 months than children from families with incomes below poverty level (22.7% versus 17.0%). Approximately half (50.9%) of children aged 6--17 years were reported to participate in sports, hobbies, or other activities that can cause eye injury (Table 3). Boys were more involved in activities that can cause eye injury than girls (60.8% versus 40.6%). In addition, as family income increased, participation in these types of activities also increased. Of children engaged in these activities, 14.6% were reported to use protective eyewear all or most of the time. Among those engaged in activities that can cause eye injuries, boys were more likely than girls to use protective eyewear (16.9% versus 11.1%). Use of protective eyewear did not vary significantly by race/ethnicity, income, or age group. Reported by: MF Cotch, PhD, R Janiszewski, MS, National Eye Institute, National Institutes of Health. RJ Klein, MPH, KM Turczyn, MPH, KM Brett, PhD, Office of Analysis and Epidemiology, National Center for Health Statistics; A Ryskulova, MD, EIS Officer, CDC. Editorial Note:The findings in this report indicate that the national health objective for 2010 to reduce the number of children with visual impairment and blindness to 20 per 1,000 children has not yet been achieved. In 2002, the prevalence of visual impairment and blindness (25 per 1,000 children) remained nearly the same as in the baseline year 1997 (24 per 1,000 children) (3). The prevalence of visual impairment and blindness was higher among children aged 6--17 years than among younger children. However, the percentage of children aged <6 years who had received a vision test (36.3%) was below the national health objective target of 52% (3), suggesting that the difference by age is less substantial because of lack of screening; many parents or caretakers might not be aware of their childrens' visual difficulties until they begin school. Children from poorer families were more likely to have visual impairment and less likely to visit an eye-care provider than their higher-income counterparts. Visual cues are important to how a child learns to understand and function in the world. Impaired vision can affect a child's cognitive, emotional, neurologic, and physical development by potentially limiting the range of experiences and the kinds of information to which the child is exposed (6). Children with visual impairment might have additional disabilities; nearly three quarters of visually impaired children aged 3--10 years in a metropolitan Atlanta developmental disabilities surveillance study also had one or more other developmental disabilities, such as mental retardation, cerebral palsy, hearing loss, or epilepsy (1). A substantial percentage of visually impaired children can have their vision improved with eyeglasses or surgery if their conditions are diagnosed in a timely manner. The findings in this report are subject to at least three limitations. First, proxy-reported visual impairment might differ from measured visual impairment. Second, the interviewed parent or family member might not have complete information on the nature and extent of a child's condition. Finally, because of low prevalence of these conditions and small sample sizes, data for certain racial/ethnic populations might be unreliable. Reducing visual impairment and increasing use of eye-care services and protective eyewear are public health priorities for U.S. residents of all ages. Nearly all eye injuries can be prevented with the proper selection and use of protective eyewear (7). A strategy aimed at teaching children from an early age to use protective eyewear, including sunglasses, might have a life-long impact on their ocular health (8). In 2002, approximately 50% of children were involved in sports and other activities that can cause eye injury, and less than 15% of them used protective eyewear always or most of the time. A national health objective for 2010 aims to increase the use of protective eyewear in recreational activities and hazardous situations around the home to 20%; in 2002, the proportion of children using protective eyewear was below this target. The American Academy of Ophthalmology and the American Academy of Pediatrics provide a list of recommended eye protection for specific sports and activities (7), enabling parents to choose eyewear depending on their child's activities. Public health surveillance programs on vision should continue to use NHIS data to help design and implement effective strategies to improve the nation's visual health. References
† The latter half of this question was asked only for children aged >2 years.
Table 1 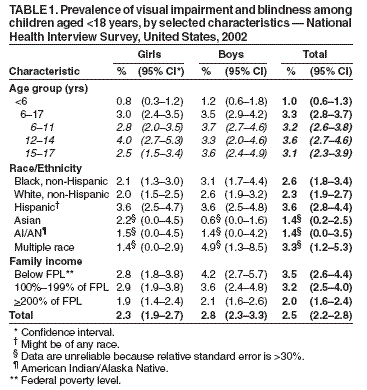 Return to top. Table 2 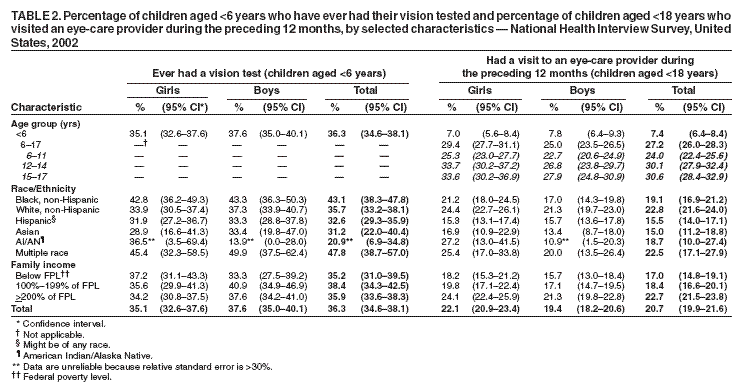 Return to top. Table 3 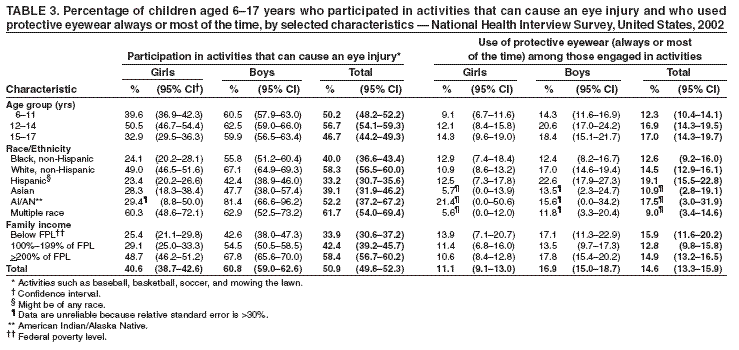 Return to top.
Disclaimer All MMWR HTML versions of articles are electronic conversions from ASCII text into HTML. This conversion may have resulted in character translation or format errors in the HTML version. Users should not rely on this HTML document, but are referred to the electronic PDF version and/or the original MMWR paper copy for the official text, figures, and tables. An original paper copy of this issue can be obtained from the Superintendent of Documents, U.S. Government Printing Office (GPO), Washington, DC 20402-9371; telephone: (202) 512-1800. Contact GPO for current prices. **Questions or messages regarding errors in formatting should be addressed to [email protected].Date last reviewed: 5/5/2005 |
|||||||||
|