 |
|
|
|
|
|
|
| ||||||||||
|
|
|
|
|
|
|
||||
| ||||||||||
|
|
|
|
|
Persons using assistive technology might not be able to fully access information in this file. For assistance, please send e-mail to: [email protected]. Type 508 Accommodation and the title of the report in the subject line of e-mail. Surveillance for Characteristics of Health Education Among Secondary Schools --- School Health Education Profiles, 1998State and Local School Health Education Profiles Coordinators
Surveillance for Characteristics of Health Education Among Secondary Schools --- School Health Education Profiles, 1998Jo Anne Grunbaum, Ed.D.1 1Division of Adolescent and School Health, National Center for
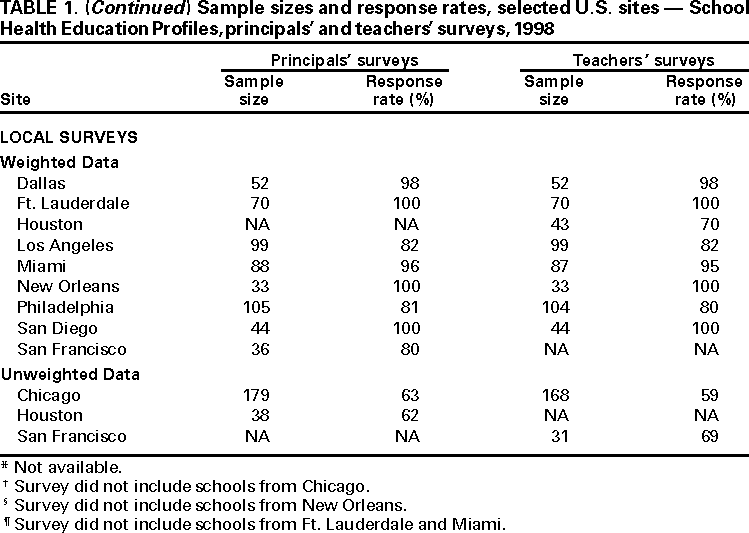
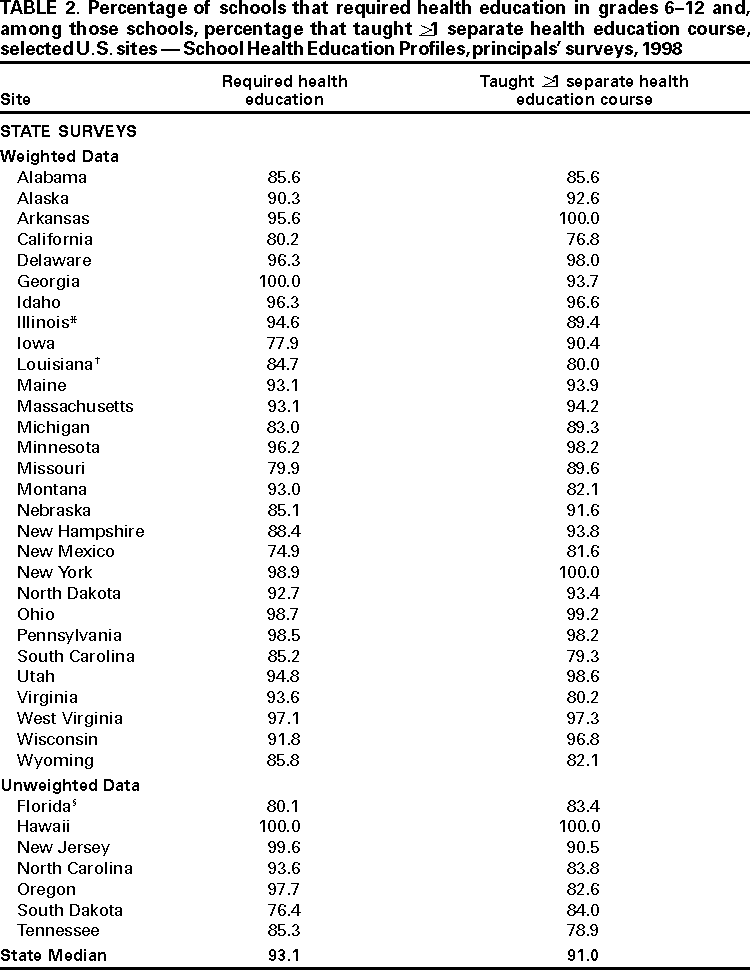
Chronic Disease Prevention and Health Promotion, CDC AbstractProblem/Condition: School health education (e.g., classroom instruction) is an essential component of school health programs; such education promotes the health of youth and improves overall public health. Reporting Period: February--May 1998. Description of System: The School Health Education Profiles monitor characteristics of health education in middle or junior high schools and senior high schools in the United States. The Profiles are school-based surveys conducted by state and local education agencies. This report summarizes results from 36 state surveys and 10 local surveys conducted among representative samples of school principals and lead health education teachers. The lead health education teacher coordinates health education policies and programs within a middle/junior high school or senior high school. Results: During the study period, most schools in states and cities that conducted Profiles required health education in grades 6--12. Of these, a median of 91.0% of schools in states and 86.2% of schools in cities taught a separate health education course. The median percentage of schools in each state and city that tried to increase student knowledge in selected topics (i.e., prevention of tobacco use, alcohol and other drug use, pregnancy, human immunodeficiency virus [HIV] infection, other sexually transmitted diseases, violence, or suicide; dietary behaviors and nutrition; and physical activity and fitness) was >73% for each of these topics. The median percentage of schools with a health education teacher who coordinated health education was 38.7% across states and 37.6% across cities. A median of 41.8% of schools across states and a median of 31.0% of schools across cities had a lead health education teacher with professional preparation in health and physical education, whereas a median of 6.0% of schools across states and a median of 5.5% of schools across cities had a lead health education teacher with professional preparation in health education only. A median of 19.3% of schools across states and 21.2% of schools across cities had a school health advisory council. The median percentage of schools with a written school or school district policy on HIV-infected students or school staff members was 69.7% across states and 84.4% across cities. Interpretation: Many middle/junior high schools and senior high schools require health education to help provide students with knowledge and skills needed for adoption of a healthy lifestyle. However, these schools might not be covering all important topic areas or skills sufficiently. The number of lead health education teachers who are academically prepared in health education and the number of schools with school health advisory councils needs to increase. Public Health Action: The Profiles data are used by state and local education officials to improve school health education. INTRODUCTIONSchool health education helps students develop knowledge and skills they need to avoid or modify behaviors related to the leading causes of death, illness, and injury both during youth and adulthood. The quality of school health education is determined, in part, by the curriculum planning and development process, teacher preparation, curriculum implementation, and assessment and evaluation (1), as well as the resources available to accomplish these tasks. Curriculum planning and development is enhanced when schools have a school health coordinator and collaborate with parents and community groups. Partnerships between schools and community groups contribute to successful school health programs, increased student knowledge, and improved skills (2). Health education teachers need to be academically prepared to teach health education and have opportunities for professional development to maintain and improve their knowledge and skills. Lack of teacher training is a serious obstacle to the implementation of effective school health education (3). Teachers who receive training implement health education curricula with more fidelity compared with teachers who do not receive training, resulting in more knowledge gain among students (4). Health education curricula should be planned, sequential, and implemented for all grades in elementary and middle/junior high schools and through >1 semester in senior high schools (1,5). Collaboration among health education teachers and other school staff members also improves the implementation of the health education curricula. To supplement the separate health education course, health-related information can be included in a range of disciplines, including physical education, the sciences, mathematics, language arts, social studies, home economics, and the arts (6). Evaluation of the health education curriculum should include assessment of student knowledge and skills. Assessment data should be used to improve curriculum development and implementation. In 1995, CDC collaborated with state and large local education agencies to develop the School Health Education Profiles to assess the status of school health education across states and cities. Data were collected in 1996 (7) and again in 1998. State and local education agencies have used these data to monitor characteristics of and assess trends in health education in middle/junior high schools and senior high schools in their jurisdiction. The Profiles include data from a questionnaire completed by each school's principal and a questionnaire completed by each school's lead health education teacher (i.e., the person who coordinates health education policies and programs within a middle/junior high school or senior high school). This report summarizes data from the 1998 Profiles (principals' surveys were conducted in 36 states and 10 cities; lead health education teachers' surveys were conducted in 35 states and 10 cities) and compares these data with the 1996 Profiles data. Education agencies repeated the Profiles in Spring 2000. METHODSSampling The Profiles employ systematic equal-probability sampling strategies to produce representative samples of schools serving students in grades 6--12 in each jurisdiction. In most states and cities, the sampling frame consists of all regular secondary public schools with >1 of grades 6--12. Some education agencies modify this procedure by inviting all schools, rather than just a sample, to participate. Data Collection At each school, data are collected during the spring semester. The principal's questionnaire and the lead health education teacher's questionnaire are both mailed to the principal of each sampled school. The principal determines who the lead health education teacher is and distributes the questionnaire accordingly. Completion of the survey is confidential and voluntary. Responses are recorded on the questionnaire booklet by the principal or teacher and returned directly to the state or local education agency. Follow-up telephone calls and written reminders are used to encourage participation. Data Analysis A weighting factor is applied to each record to reflect the likelihood of principals or teachers being selected and to adjust for differing patterns of nonresponse. Data from a state or city with an overall response rate of >70% and appropriate documentation were weighted, whereas data from a state or city that did not meet these criteria were not weighted. Weighted data are representative of all public schools serving grades 6--12 in the jurisdiction; unweighted data are representative only of the participating schools. Because of a low response rate, data from principals' surveys conducted in two states and lead health education teachers' surveys conducted in three states are not included in this report. Thus, this report represents information from 35 states with data from both principals' and lead health education teachers' surveys, one state with data from only the principals' survey, and 10 cities with data from both principals' and lead health education teachers' surveys (Table 1). Across states, the sample sizes of the principals' surveys ranged from 55 to 577, and the response rates ranged from 52% to 96%; across cities, the sample sizes ranged from 33 to 179, and the response rates ranged from 62% to 100% (Table 1). The sample sizes of the lead health education teachers' surveys across states ranged from 54 to 571, and the response rates ranged from 50% to 95%; across cities, the sample sizes ranged from 31 to 168, and the response rates ranged from 59% to 100%. SAS software was used to compute point estimates (8). Medians are presented for all states (i.e., those with weighted data and those with unweighted data combined) and for all cities (i.e., those with weighted data and those with unweighted data combined). The Wilcoxon rank-sum test was used to test for differences between 1996 and 1998 data across states and cities. This is a nonparametric analogue to a two-sample t-test. This statistical procedure a) rank ordered all sites for both years separately for states and cities; b) summed the ranks separately by year and for states and cities; and c) compared the rank sums separately for states and cities to determine if the distribution of the variable was the same for 1998 and 1996. Assuming that the percentages have an underlying continuous distribution, the distribution of ranks is approximately normal; therefore, a z-value was used as the test statistic. The distributions were considered significantly different at p < .05. RESULTSHealth Education Courses Required Health Education Across states, the median percentage of schools that required health education for students in grades 6--12 was 93.1% (range: 74.9%--100%) (Table 2). Across cities, the median percentage of schools that required health education for students in grades 6--12 was 92.1% (range: 2.3%--100%). Among schools that required health education, the median percentage that taught >1 separate health education course was 91.0% (range: 76.8%--100%) across states and 86.2% (range: 51.2%--97.8%) across cities. Curricula, Guidelines, and Frameworks for Required Health Education Courses The median percentage of schools with a required health education course (Table 3) that required teachers to use*
Content of Required Health Education Courses The median percentage of schools that tried to increase student knowledge ** (Table 4) in
The median percentage of schools that tried to improve student skills ** (Table 5) in
Coordination of Health Education Across states and cities, a health education teacher was identified most often (state median: 38.7%; local median: 37.6%) as being responsible for coordinating health education (Table 6). A school district administrator was less likely (state median: 21.3%; local median: 8.2%) to be responsible for coordinating health education, as was a school administrator (state median: 24.4%; local median: 18.1%). A school nurse infrequently or rarely (state median: 1.7%; local median: 2.1%) coordinated health education. The median percentage of schools in which no one was responsible for coordinating health education was 3.9% across states and 3.7% across cities. The median percentage of schools in which health education teachers planned or coordinated health-related projects or activities (Table 7) with
Professional Preparation of Lead Health Education Teachers The median percentage of schools in which the lead health education teacher had professional preparation (Table 8) in
Inservice Training in Health Education Topics The median percentage of schools in which the lead health education teacher had received >4 hours of inservice training during the preceding 2 years (Table 9) in
The median percentage of schools in which the lead health education teacher wanted inservice training (Table 10) in
Parental and Community Involvement in School Health Education School health advisory councils can involve the community and parents in conducting needs assessments, developing school policies, and coordinating school programs and resources. The percentage of schools with an advisory council ranged from 6.6% to 56.8% (median: 19.3%) across states and from 10.0% to 100% (median: 21.2%) across cities. The median percentage of schools that reported receiving parental feedback on health education was 55.2% (range: 34.4%--70.2%) across states and 53.0% (range: 40.0%--84.0%) across cities (Table 11). Among those that received feedback, the median percentage of schools that received mainly positive feedback was 86.9% across states and 91.3% across cities. The median percentage of schools that received mainly negative feedback was 1.3% across states and 0.0% across cities, and the median percentage that received equally positive and negative feedback was 11.8% across states and 8.7% across cities. The median percentage of schools that involved parents in school health education (Table 12) by
HIV Infection/AIDS Education Among schools that taught HIV infection/AIDS education as part of a required health education course, the median percentage of schools (Table 13) that taught
Policies on HIV-Infected Students or School Staff Members The median percentage of schools with a written school or school district policy on HIV-infected students or school staff members was 69.7% (range: 48.7%--87.6%) across states and 84.4% (range: 76.3%--100%) across cities (Table 14). Among those that had a written policy, the median percentage of schools with a written policy that addressed
Changes Between the 1996 and 1998 Profiles The Profiles were conducted in 1996 and 1998, with both surveys using many of the same questions. For this report, data from questions that were the same in 1996 and 1998 were analyzed for changes over time (data not shown).
DISCUSSIONSchool health education could be one of the most effective means to reduce and prevent serious health problems in the United States, including cardiovascular disease, cancer, motor vehicle crashes, homicide, and suicide (5). Schools and districts could improve school health education through enhanced curriculum planning and development, curriculum implementation, teacher qualification and preparation, and assessment and evaluation (1). The Profiles provide data related to the first three categories. The 1998 Profiles data demonstrated that many schools have implemented programs and policies that can have a positive influence on health education curriculum planning and development. The median percentage of schools without a health education coordinator was only 3.9% among states and 3.7% among cities. The percentage of schools that planned or coordinated health education projects or activities with the PTA/PTO was low, but the median percentage of schools that planned or coordinated such projects or activities with medical or public health persons was 56.8% across states and 56.1% across cities. Schools need to increase collaboration with families and medical and public health personnel. According to the 1998 Profiles data, some health education teachers are collaborating with teachers in other subject areas to implement health education. The median percentage of schools in which health education teachers planned or coordinated health-related projects with PE teachers, school counselors, or health services or food service staff members ranged from 12.4% to 56.3% across states and from 10.7% to 57.2% across cities. Collaborative curriculum planning between health education teachers and other school staff members should be encouraged. Few schools had a lead health education teacher whose professional preparation was in health education only, but more schools had a lead health education teacher with professional preparation in health and physical education. However, many schools had a lead health education teacher whose professional preparation was not in health education. The number of health education teachers with training in health education needs to increase. Opportunities for professional development are important for maintaining and upgrading knowledge and skills. The median percentage of schools in which the lead health education teacher had received >4 hours of inservice training during the preceding 2 years in a specific health topic varied by topic. More frequent inservice training with the most up-to-date information is needed to help teachers confidently and effectively present health education topics to their students. Many adolescents in the United States engage in behaviors that increase their risk for HIV infection (9). The Profiles data indicated that most schools in states and cities taught skills to reduce such risk behaviors, and the median percentage of schools across states and cities that taught HIV prevention as part of a mandatory health education course was >95%. To help education agencies select health-related curricula that are effective in changing behavior, CDC identifies curricula with credible evidence of reducing health risk behaviors among youth. Five curricula that have demonstrated evidence of reducing sexual risk behaviors for HIV infection, other STDs, and unintended pregnancies are Be Proud! Be Responsible! Strategies to Empower Youth to Reduce Their Risk for AIDS; Get Real About AIDS®; Reducing the Risk: Building Skills to Prevent Pregnancy, STDs, and HIV; Becoming a Responsible Teen; and Focus on Kids: HIV Awareness. Two curricula that have demonstrated evidence of reducing tobacco use are Project Toward No Tobacco Use (Project TNT) and Life Skills Training. The findings in this report are subject to several limitations. First, these data apply only to public middle/junior high schools and senior high schools. Second, the data are self-reported by principals and lead health education teachers. Finally, the Profiles data do not provide an indepth assessment of all elements of school health education. To provide a more comprehensive description of school health education and other components of school health programs, CDC periodically conducts the School Health Policies and Programs Study (SHPPS). SHPPS was first conducted in Spring 1994 (10) and repeated in Spring 2000 (11). SHPPS 2000 is designed to achieve the following goals:
The SHPPS and Profiles provide important data regarding school health education in the United States. These data can be used by state and local education officials to improve programs in this field. References
* Schools could report use of >1 required curriculum. ** In a required health education course. *** Parent Teacher Association/Parent Teacher Organization.
Disclaimer All MMWR HTML versions of articles are electronic conversions from ASCII text into HTML. This conversion may have resulted in character translation or format errors in the HTML version. Users should not rely on this HTML document, but are referred to the electronic PDF version and/or the original MMWR paper copy for the official text, figures, and tables. An original paper copy of this issue can be obtained from the Superintendent of Documents, U.S. Government Printing Office (GPO), Washington, DC 20402-9371; telephone: (202) 512-1800. Contact GPO for current prices. **Questions or messages regarding errors in formatting should be addressed to [email protected].Page converted: 8/14/2000 |
|||||||||||||||||||||||||||||||||||||||||||||||||||||||||||||||||||||||||||||||||||||||||||||||||||||||||||||||||||||||||||||||||||||||||||||||
This page last reviewed 5/2/01
|