 |
|
|
|
|
|
|
| ||||||||||
|
|
|
|
|
|
|
||||
| ||||||||||
|
|
|
|
|
Persons using assistive technology might not be able to fully access information in this file. For assistance, please send e-mail to: [email protected]. Type 508 Accommodation and the title of the report in the subject line of e-mail. Vaccination Coverage Among Children Enrolled in Head Start Programs or Day Care Facilities or Entering SchoolRuth B. Jiles, Ph.D.1 1Assessment Branch, Data Management Division
National Immunization Program AbstractProblem/Condition: Undervaccinated children enrolled in day care centers and schools are vulnerable to outbreaks of vaccine-preventable diseases. A Healthy People 2000 objective is to increase to >95% vaccination coverage among children attending licensed day care facilities and kindergarten through postsecondary school (objective 20.11). Reporting Period Covered: September 1997--June 1998. Description of System: CDC's National Immunization Program administers grants to support 64 vaccination programs. These programs are in all 50 states, eight territories or jurisdictions (American Samoa, Republic of Marshall Islands, Federated States of Micronesia, Guam, Commonwealth of Northern Mariana Islands, Puerto Rico, Republic of Palau, and the U.S. Virgin Islands), five cities (Chicago, Houston, San Antonio, New York City, and Philadelphia), and the District of Columbia. Grant guidelines require annual school vaccination surveys and biennial surveys of Head Start programs and licensed day care facilities. This system constitutes the only source of nationally representative vaccination coverage estimates for these populations. Results: Head Start Programs: Of the 64 reporting areas, 33 (51.6%) submitted coverage levels for children enrolled in Head Start programs. Of these, all 33 programs reported coverage levels for diphtheria and tetanus toxoids and pertussis vaccine (DTP), diphtheria and tetanus toxoids (DT), or tetanus toxoids (Td), poliovirus vaccine, and measles vaccine; and 32 reported coverage levels for mumps and rubella vaccines. Four programs reported coverage levels for the combined measles, mumps, and rubella vaccine (MMR). The mean vaccination coverage levels for the 1997--98 school year among the reporting vaccination programs were 97.8% for poliovirus vaccine (range: 80.0%--100.0%), 97.0% for DTP/DT/Td (range: 87.7%--100.0%), 93.3% for measles vaccine (range: 91.4%--100.0%), and 93.2% for mumps and rubella vaccines (range: 91.4%--100.0%). Licensed Day Care Facilities: Of the 63 reporting areas with licensed day care facilities, 38 (60.3%) submitted coverage levels for enrolled children. Of these, all 38 programs reported coverage levels for poliovirus vaccine and DTP/DT/Td, 37 reported coverage levels for measles vaccine, and 36 reported coverage levels for mumps and rubella vaccines. Four programs reported coverage levels for the combined MMR. The mean vaccination coverage levels among the reporting areas were 95.8% for poliovirus vaccine (range: 85.1%--99.8%), 95.7% for DTP/DT/Td (range: 77.6%--99.9%), 89.1% for measles vaccine (range: 78.0%--99.9%), and 89.1% for mumps and rubella vaccines (range: 78.0%--99.9%). Kindergarten/First Grade: Of the 64 reporting areas, 43 (67.2%) submitted coverage levels for children enrolled in kindergarten and first grade. Of these 43 programs, 42 reported coverage levels for poliovirus vaccine and DTP/DT/Td, and 43 reported coverage levels for measles, mumps, and rubella vaccines. Four of the 43 programs reported coverage levels for the combined MMR. The mean vaccination coverage levels among the reporting areas were 96.7% for poliovirus vaccine (range: 82.8%--99.9%), 96.7% for DTP/DT/Td (range: 82.8%--99.8%), 96.0% for measles vaccine (range: 82.8%--99.9%), and 96.5% for mumps and rubella vaccines (range: 82.8%--99.9%). Interpretation: High levels of vaccination coverage among children entering school most likely result from the successful implementation of state-specific school vaccination laws, which have applied to children entering school in all states and the District of Columbia since at least 1990. All states, territories, and the District of Columbia have additional laws that require vaccination of children in licensed day care facilities. However, because a high proportion of states and territories did not submit vaccination coverage reports to CDC, these estimated means may not reflect levels for all children in the United States. INTRODUCTIONSchools and day care centers are places where children come into close contact, facilitating transmission of disease. Undervaccinated children enrolled in day care facilities (1) and schools (2) are vulnerable to outbreaks of vaccine-preventable diseases. State-specific laws in the United States require children to be up to date with vaccinations on entering licensed day care or school and require documentation to be kept on site in the child's health record. A Healthy People 2000 objective is to increase to >95% vaccination coverage among children attending licensed day care facilities and kindergarten through postsecondary school (objective 20.11) (3). CDC's National Immunization Program administers grants to support 64 vaccination programs. These programs are in all 50 states, eight territories or jurisdictions (American Samoa, Republic of Marshall Islands, Federated States of Micronesia, Guam, Commonwealth of Northern Mariana Islands, Puerto Rico, Republic of Palau, and the U.S. Virgin Islands), five cities (Chicago, Houston, San Antonio, New York City, and Philadelphia), and the District of Columbia. Grant guidelines require annual school vaccination surveys and biennial surveys of Head Start programs and licensed day care facilities. This system constitutes the only source of nationally representative vaccination coverage estimates for these populations. This is the first report of state-specific results from day care and school vaccination assessments conducted by the 64 vaccination programs that are recipients of CDC grant funds. The report summarizes vaccination coverage data collected during the 1997--98 school year and reported to CDC through April 28, 1999. Coverage levels are reported for poliovirus vaccine; diphtheria and tetanus toxoids and pertussis vaccine (DTP), diphtheria and tetanus toxoids (DT), and tetanus toxoid (Td); and measles, mumps, and rubella vaccines. METHODSMethods of assessing vaccination coverage differ among the 64 reporting areas, in part because state and territorial laws determine which vaccines and doses are required for day care or school attendance (4) and sampling and data abstraction methods vary. In this report, overall mean coverage levels were estimated by weighting the vaccine-specific coverage levels reported by the vaccination programs to the appropriate birth cohorts. The 64 vaccination programs report summary coverage levels to CDC using a standard one-page form. This form provides a single line to report the proportion of children with three or more doses of DTP/DT/Td and three or more doses of poliovirus vaccine. Separate lines are provided for reporting coverage levels for measles, mumps, and rubella vaccines. In six reporting areas, pertussis vaccination is not required; in at least three reporting areas, mumps vaccination is not required. RESULTSHead Start ProgramsOf the 64 reporting areas, 33 (51.6%) submitted coverage levels for children enrolled in Head Start programs (Table 1). Nebraska, Oklahoma, and Texas combined results from Head Start with data from licensed day care facilities; levels from these states are reported with day care results. Of these 33 programs, all reported coverage levels for poliovirus vaccine, DTP/DT/Td, and measles vaccine; 32 reported coverage levels for mumps and rubella vaccines. Four of the 33 programs reported coverage levels for the combined measles, mumps, and rubella vaccine (MMR). The mean vaccination coverage levels among the reporting vaccination programs were 97.8% for poliovirus vaccine (range: 80.0%--100.0%), 97.0% for DTP/DT/Td (range: 87.7%--100.0%), 93.3% for measles vaccine (range: 91.4%--100.0%), and 93.2% for mumps and rubella vaccines (range: 91.4%--100.0%). The proportions of reporting areas that achieved the goal of >95% coverage were 78.8% (26 of 33) for poliovirus vaccine, 63.6% (21 of 33) for DTP/DT/Td , 87.8% (29 of 33) for measles vaccine, and 84.3% (27 of 32) for mumps and rubella vaccines. All four programs that reported coverage for the combined MMR achieved the goal of >95% coverage. Licensed Day Care FacilitiesOf the 63 reporting areas with licensed day care facilities, 38 (60.3%) submitted coverage levels for enrolled children (Table 2). Of these 38 programs, all reported coverage levels for poliovirus vaccine and DTP/DT/Td, 37 reported coverage levels for measles vaccine, and 36 reported coverage levels for mumps and rubella vaccines. Four of the 38 programs reported coverage levels for the combined MMR. The mean vaccination coverage levels among reporting vaccination programs were 95.8% for poliovirus vaccine (range: 85.0%--99.8%), 95.7% for DTP/DT/Td (range: 77.6%--99.9%), 89.1% for measles vaccine (range: 78.0%--99.9%), and 89.1% for mumps and rubella vaccines (range: 78.0%--99.9%). The proportions of reporting areas that achieved the goal of >95% coverage were 57.9% (22 of 38) for poliovirus vaccine, 52.6% (20 of 38) for DTP/DT/Td , 59.4% (22 of 37) for measles vaccine, 58.3% (21 of 36) for mumps vaccine, and 61.1% (22 of 36) for rubella vaccine. Three of the four programs that reported coverage for the combined MMR achieved the goal of >95% coverage. Kindergarten/First GradeOf the 64 reporting areas, 43 (67.2%) submitted coverage levels for children enrolled in kindergarten and first grade (Table 3). Of these 43 programs, 42 reported coverage levels for poliovirus vaccine and DTP/DT/Td, and all 43 reported coverage levels for measles, mumps, and rubella vaccines. Four of the 43 programs reported coverage levels for the combined MMR. The mean vaccination coverage levels among the reporting vaccination programs were 96.7% for poliovirus vaccine (range: 82.8%--99.9%), 96.7% for DTP/DT/Td (range: 82.8%--99.8%), 96.0% for measles vaccine (range: 82.8%--99.9%), and 96.5% for mumps and rubella vaccines (range: 82.8%--99.9%). The proportions of reporting areas that achieved the goal of >95% coverage were 90.5% (38 of 42) for poliovirus vaccine, 92.9% (39 of 42) for DTP/DT/Td, 83.7% (36 of 43) for measles vaccine, and 88.4% (38 of 43) for mumps and rubella vaccines. All four states that reported coverage for the combined MMR achieved the goal of >95% coverage. DISCUSSIONSince 1978, vaccination coverage levels among children entering either kindergarten or first grade have been assessed annually (5); since 1980, national coverage with three or more doses of poliovirus vaccine, three or more doses of DTP/DT/Td, and one or more doses of measles, mumps, and rubella vaccines has been >90% (4). Coverage levels for the 1997--98 school year also were high; coverage among children entering kindergarten or first grade was >95% for poliovirus, DTP/DT/Td, measles, mumps, and rubella vaccines. Even though incidence of vaccine-preventable diseases is at an all-time low, high vaccination coverage must be maintained to continue to prevent transmission of disease in the population. For example, coverage levels of >95% are considered necessary to prevent transmission of measles (4). High levels of vaccination coverage among children entering school have resulted from the successful implementation and enforcement of state-specific school vaccination laws, which have applied to children entering school in all states and the District of Columbia since at least 1990 (4). Although in general parents do not delay vaccination until school entry, school laws have been highly effective (4) as a "safety net" that ensures vaccination of children by age 5 or 6 years who missed vaccination during early childhood, the time when most vaccines are recommended (6). Head Start, a program administered by the Administration for Children and Families, Department of Health and Human Services, enrolls approximately 800,000 low-income children each year. In 1998, approximately 90% of children enrolled in Head Start were aged 3--5 years, 69% were non-white, and 13% had a disability (7). The findings in this report indicate that, during the 1997--98 school year, coverage among children enrolled in Head Start was >95% for poliovirus vaccine and DTP/DT/Td, and 93% for measles, mumps, and rubella vaccines. Head Start has also documented high vaccination coverage through their own surveys; coverage for the combined series of four or more doses of DTP, three or more doses of poliovirus vaccine, and one or more doses of measles-containing vaccine was 87% among children aged 4 years (7). All states, territories, and the District of Columbia have additional laws that require vaccination of children in licensed day care facilities. The findings in this report indicate that, compared with children enrolled in Head Start or entering school, coverage levels among all children in day care are lower. Because fewer than one third of children aged <5 years receive care through day care facilities (5) and children are required to be fully vaccinated to enroll in licensed day care facilities, levels for the general population of U.S. children aged <5 years might be lower. However, low vaccination coverage levels among day care children could also reflect a younger age cohort for which the complete basic series of vaccines are not yet applicable. Obtaining information from schools is one of the least time-consuming approaches to assessing childhood vaccination coverage (8). Moreover, data from school records can potentially reflect vaccination status of nearly all U.S. children because most children, regardless of race/ethnicity, socioeconomic status, and access to care, are enrolled in schools. Accuracy is also high because information regarding vaccinations is generally based on provider records and does not rely on parent recall (4). The school surveys in this report are subject to at least two limitations. First, children attending private schools might not be included in these surveys; in a comparison of vaccination coverage for three doses of DTP, three doses of poliovirus vaccine, and one dose of MMR between public and private schools in Chicago, Illinois, and Milwaukee, Wisconsin, coverage was generally lower among children attending public schools than among those attending private schools (9). Second, in the 1997--98 survey, nearly half the vaccination programs did not submit vaccination coverage reports to CDC. Therefore, overall weighted mean estimates presented in this report might not be representative of all U.S. children. Thus, the quality and scope of the school surveys in all vaccination programs need to improve to ensure the nation's ability to identify children at risk for outbreaks of disease caused by undervaccination. High vaccination coverage levels in the U.S. school-aged population is largely the result of school laws that govern vaccination among children entering schools and licensed day care facilities (10). However, reporting areas still vary substantially in the number and doses of required vaccinations. To ensure prevention of vaccine-preventable diseases in the United States, school and day care laws should be maintained. In some reporting areas, new vaccines (e.g., varicella) should be added to reduce further vaccine-preventable diseases (11). References
Table 1 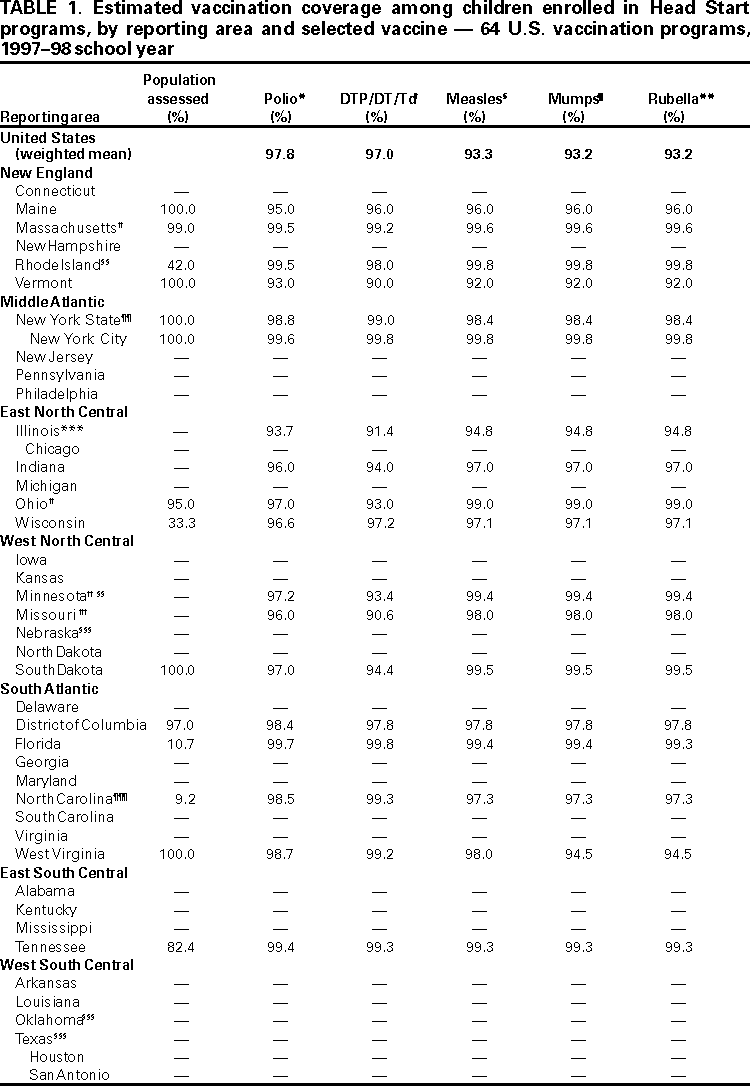  Return to top. Table 2 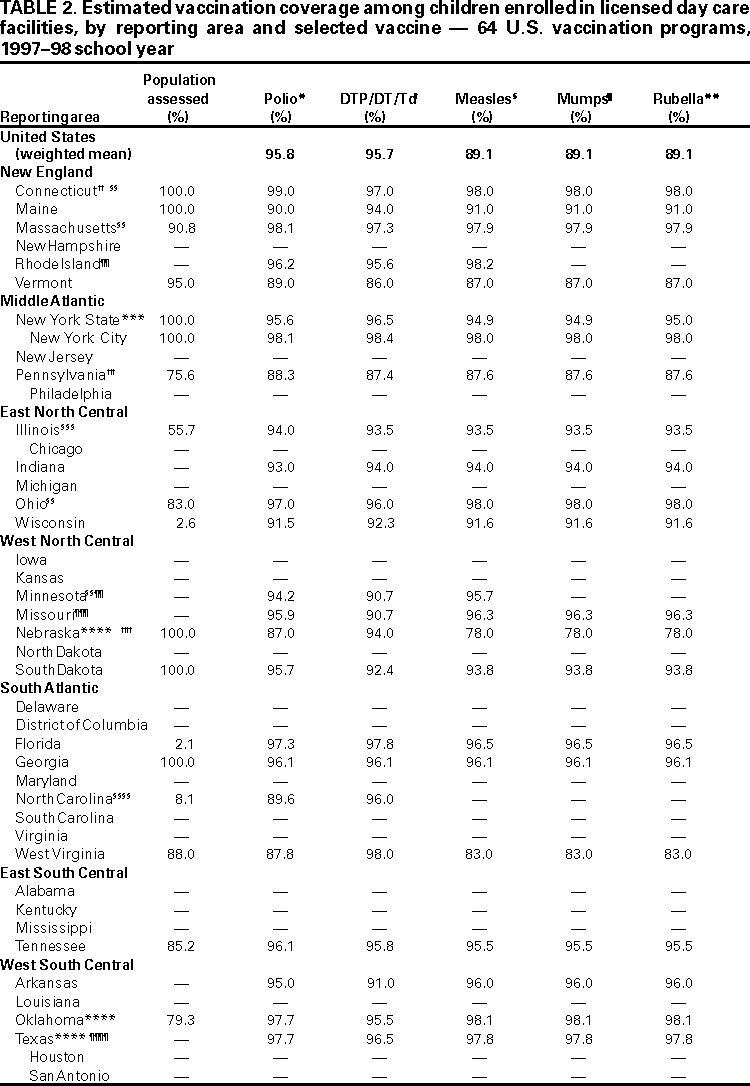 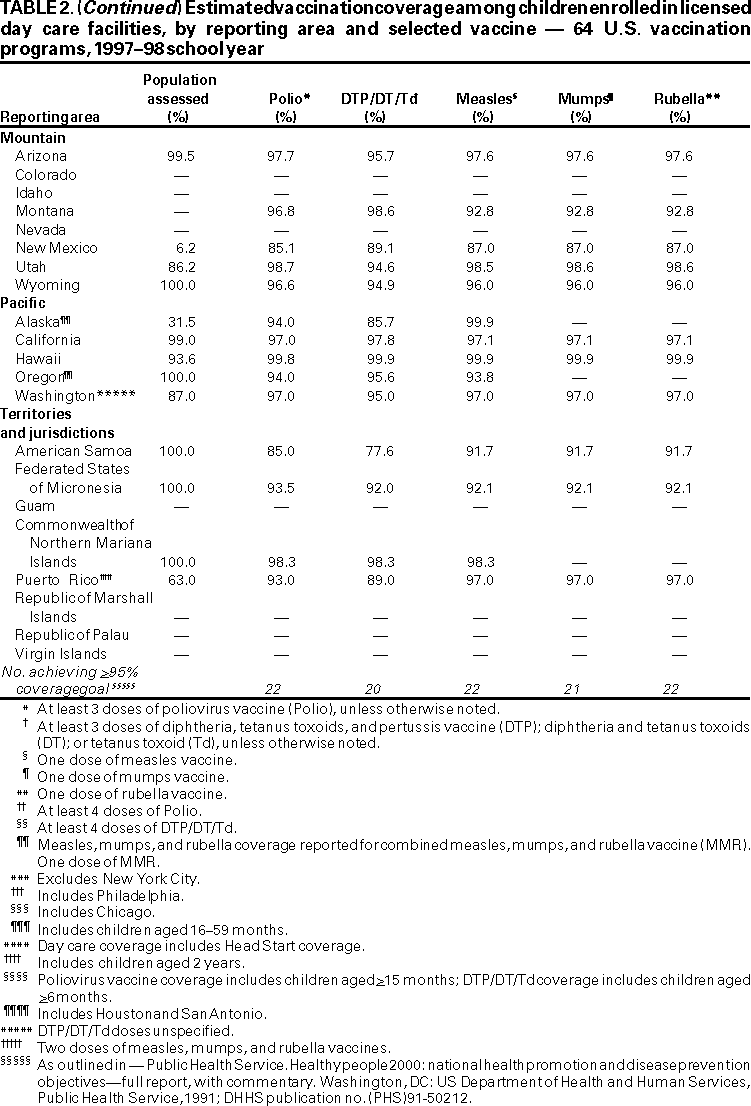 Return to top. Table 3 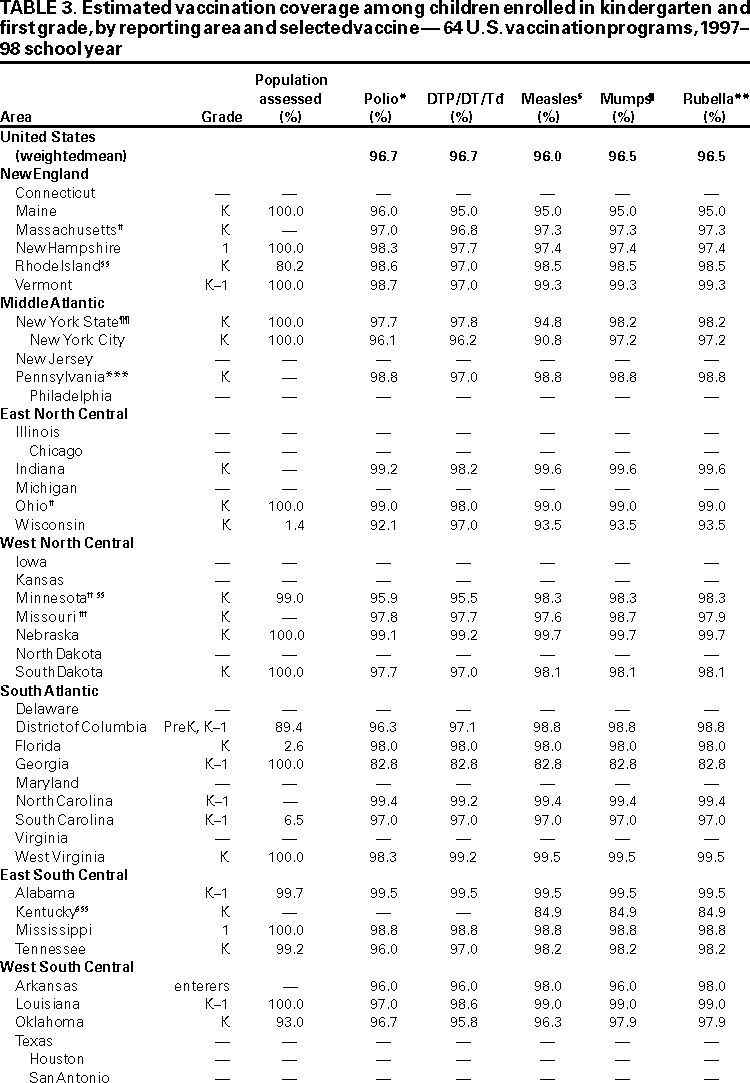 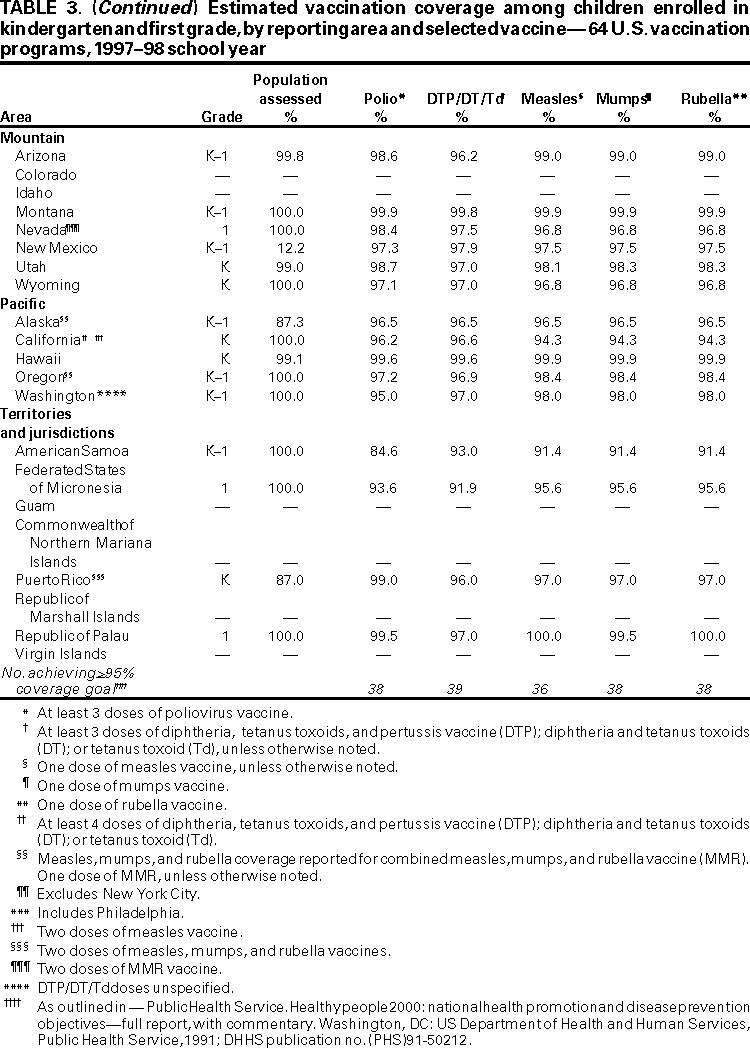 Return to top. Disclaimer All MMWR HTML versions of articles are electronic conversions from ASCII text into HTML. This conversion may have resulted in character translation or format errors in the HTML version. Users should not rely on this HTML document, but are referred to the electronic PDF version and/or the original MMWR paper copy for the official text, figures, and tables. An original paper copy of this issue can be obtained from the Superintendent of Documents, U.S. Government Printing Office (GPO), Washington, DC 20402-9371; telephone: (202) 512-1800. Contact GPO for current prices. **Questions or messages regarding errors in formatting should be addressed to [email protected].Page converted: 9/12/2000 |
|||||||||
This page last reviewed 5/2/01
|